Strategy Lab Notes
The stories behind the backtests — where each strategy came from, how it was tested, and what survived. Winners and losers alike.
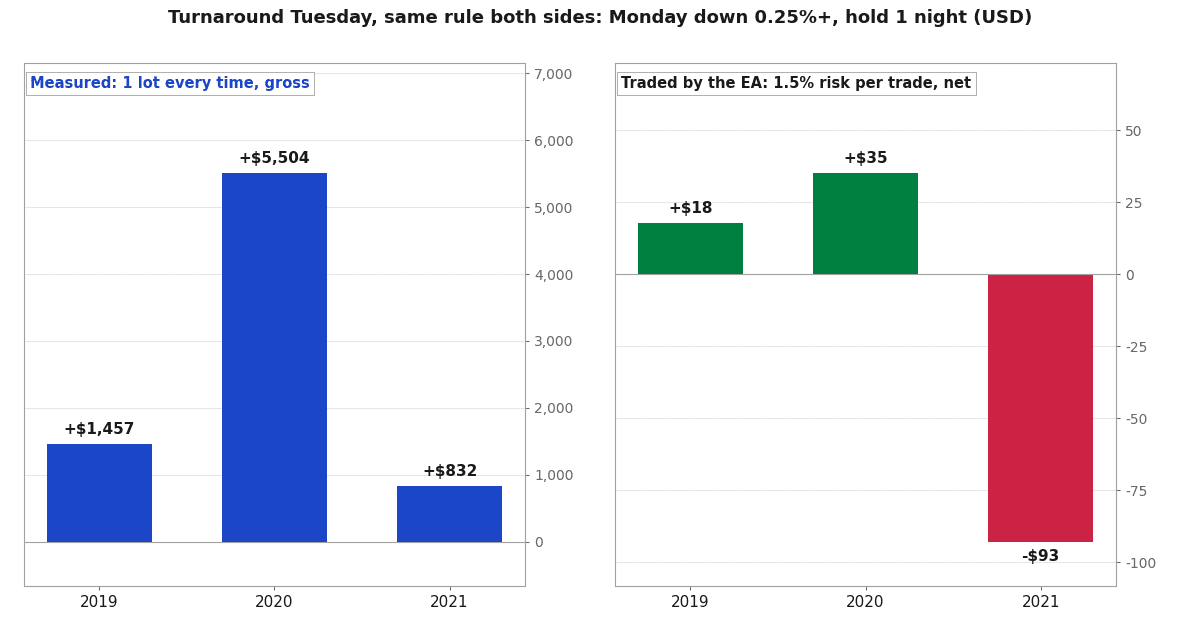
Turnaround Tuesday Measured at 6x Its Costs. Our EA Lost $40 Trading It.
We tested the Turnaround Tuesday rule on the S&P 500, Dow and Nasdaq 100. With one lot on every trade, it made about six times its costs. With normal position sizing, the same rule lost money.
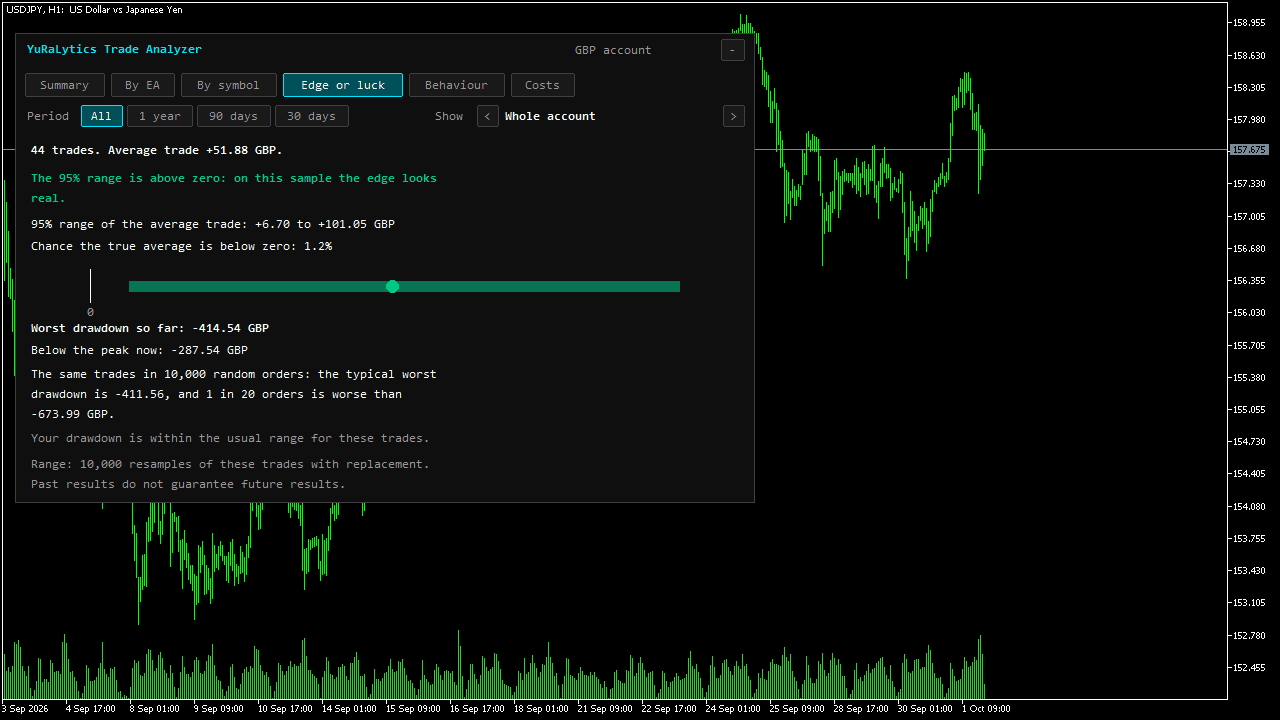
Edge or Luck? We Ran Our Own Forward Test Through a Free MT5 Check
Is your average trade really good, or was it luck? A simple test with your closed trades can tell you. We used our free YuRaLytics panel on our three demo forward-test accounts.
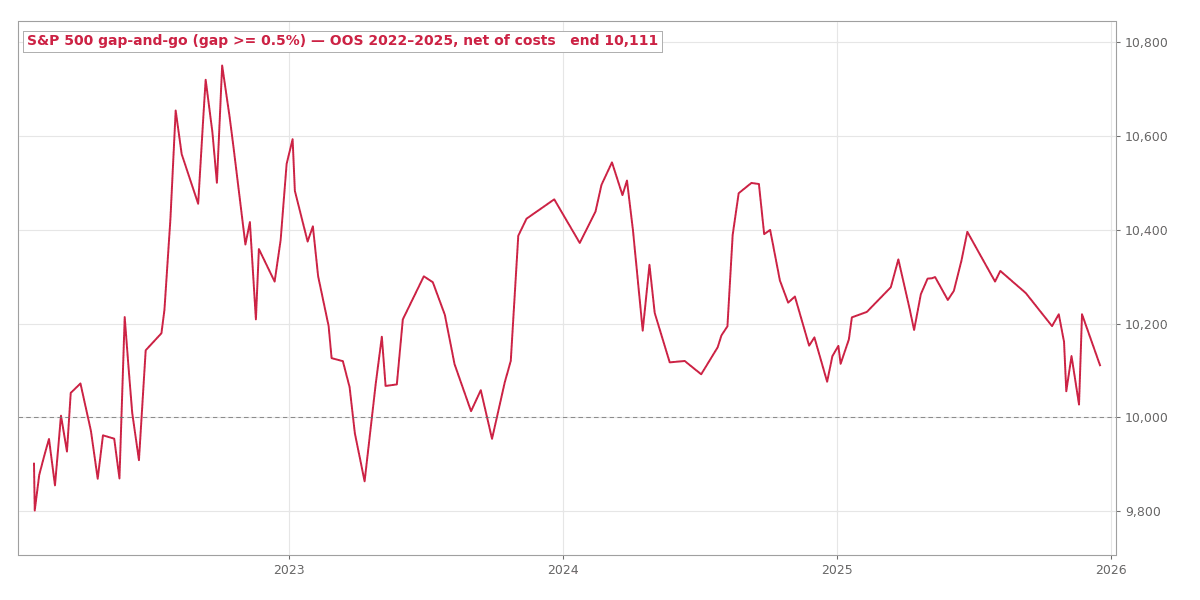
The Gap-and-Go Made Money Every Year for Five Years. Then It Stopped.
Buying the S&P 500 after a big gap up made money in every in-sample year from 2017 to 2021. It matched a measurement we planned in advance, trade for trade. On new data it made only $111 on 169 trades.
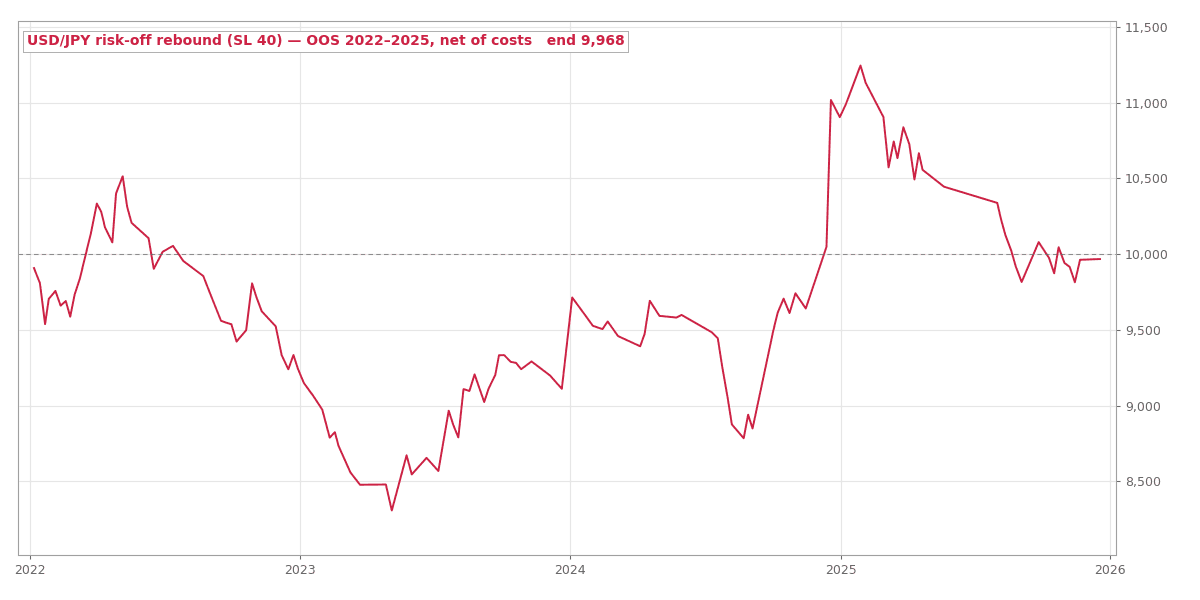
USD/JPY Bounced the Day After Every Big S&P Selloff. Then the Yen Broke.
We searched 13 markets for links between them. We found one: after a big S&P 500 down day, USD/JPY went back up the next day in every in-sample year. Real ticks, real swap, one out-of-sample test: profit factor 1.00.
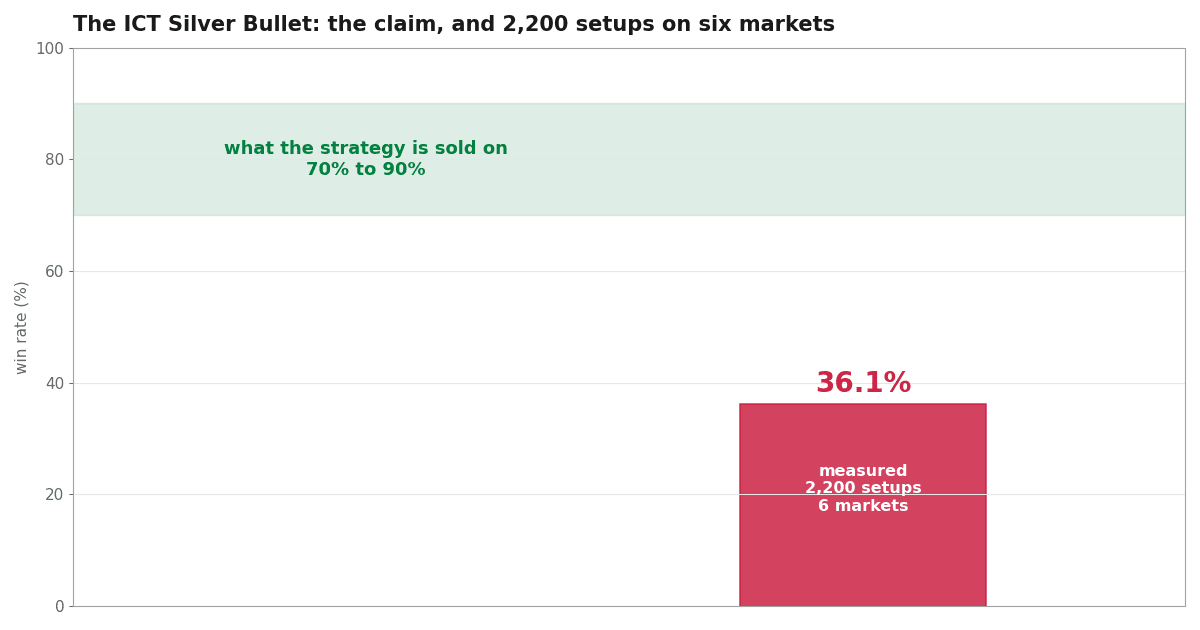
The ICT Silver Bullet Is Sold on a 70% Win Rate. We Measured 36.1%.
People say the ICT Silver Bullet wins 70 to 90% of the time. We tested all three of its one-hour windows on six markets (three US indices, EUR/USD, GBP/USD and gold) from 2019 to 2021, before writing any strategy code. In 2,200 setups it won 36.1% of the time and lost 0.24R per trade. EUR/USD and gold, which its own teachers recommend, lost more than the indices.
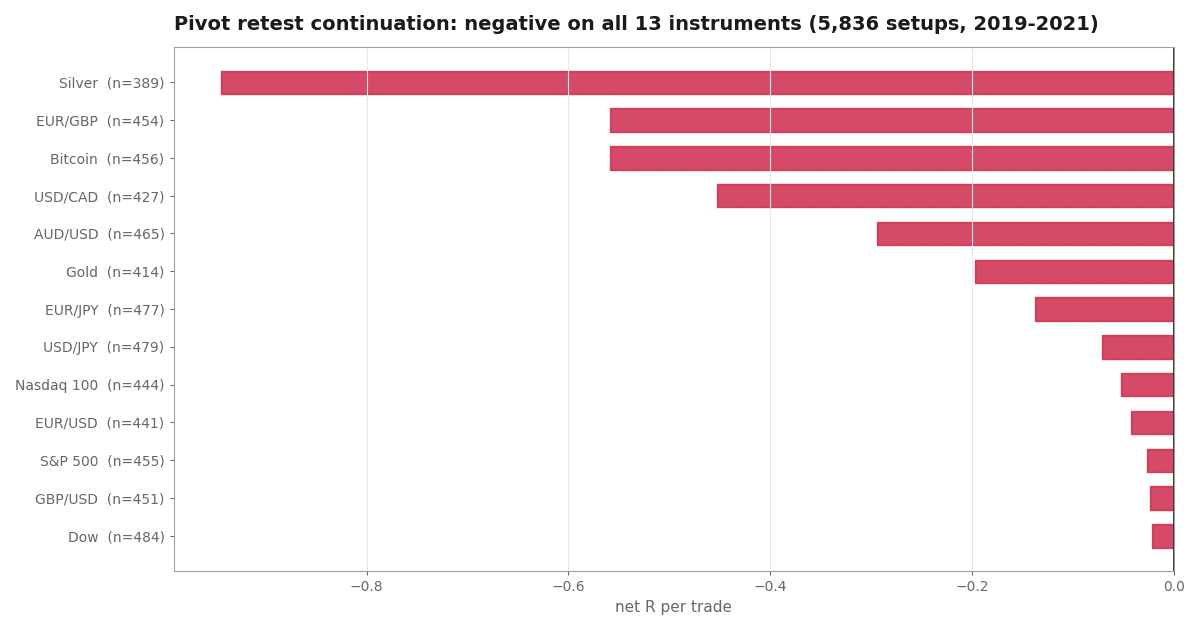
The Pivot Retest Is Negative on All Thirteen Markets We Own
Price breaks a swing high, comes back to test it, a confirmation candle forms, and you enter. Every price action course teaches this. We measured it on thirteen markets and 5,836 setups, 2019 to 2021, before writing any strategy code. It loses on all thirteen, at every profit target from 1R to 3R. And the confirmation candle, the part that is supposed to be the discipline, costs money.
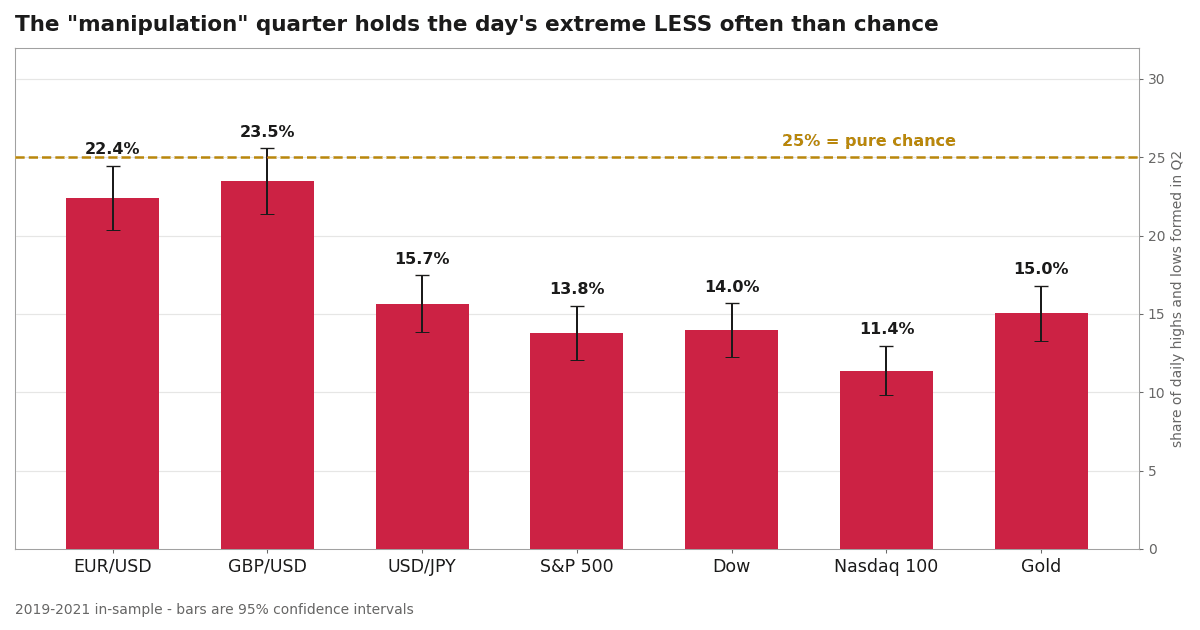
Quarterly Theory Says the Day's Extreme Forms in Q2. It's the Least Likely Quarter.
Quarterly Theory splits the trading day into four parts of six hours each. It says the second part (Q2) makes the day's high or low. We checked this on three FX majors, three US indices and gold, 2019 to 2021, before we wrote any strategy code. Q2 holds the day's high or low only 16.6% of the time. Chance alone gives 25%, and all seven markets are below chance. Trading the setup loses 0.06R per trade over 2,162 trades. With no costs at all, the price still moves 0.14R against the claim.
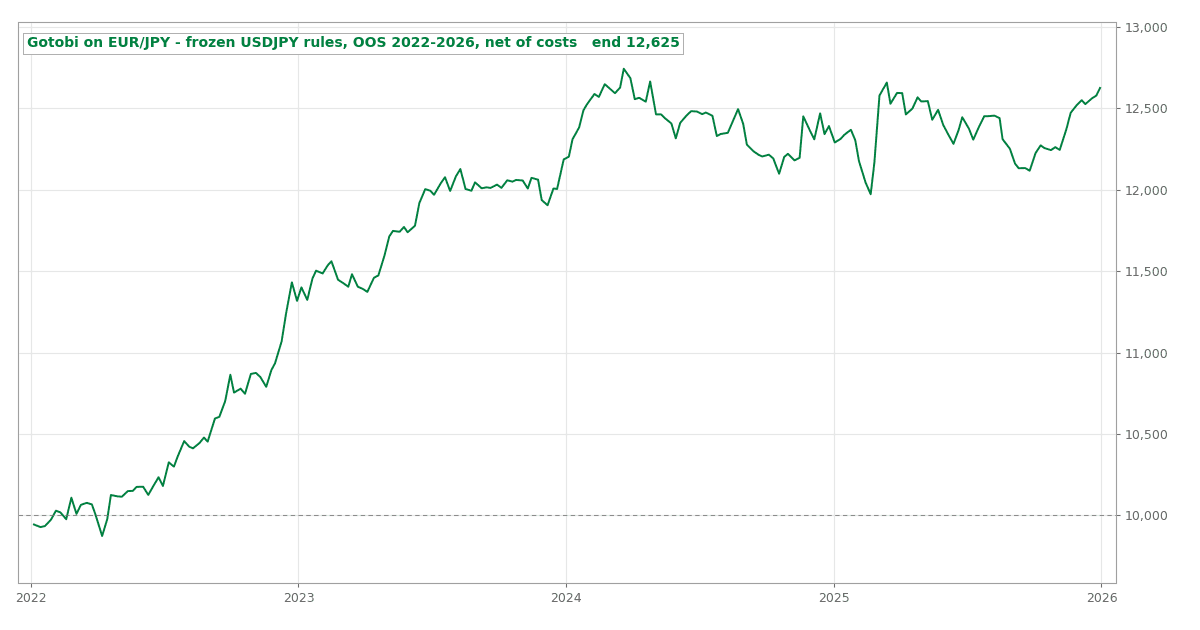
Gotobi on EUR/JPY: We Changed Nothing and It Still Worked
We took the gotobi rules that worked on USD/JPY, fixed every setting, and gave EUR/JPY exactly one test on new data. Profit factor 1.42, a profit in all four years, and one warning sign that we show openly.
The "Liquidity Grab" Fade, Measured: a Real Pattern That Loses a Third of a Pip Per Trade
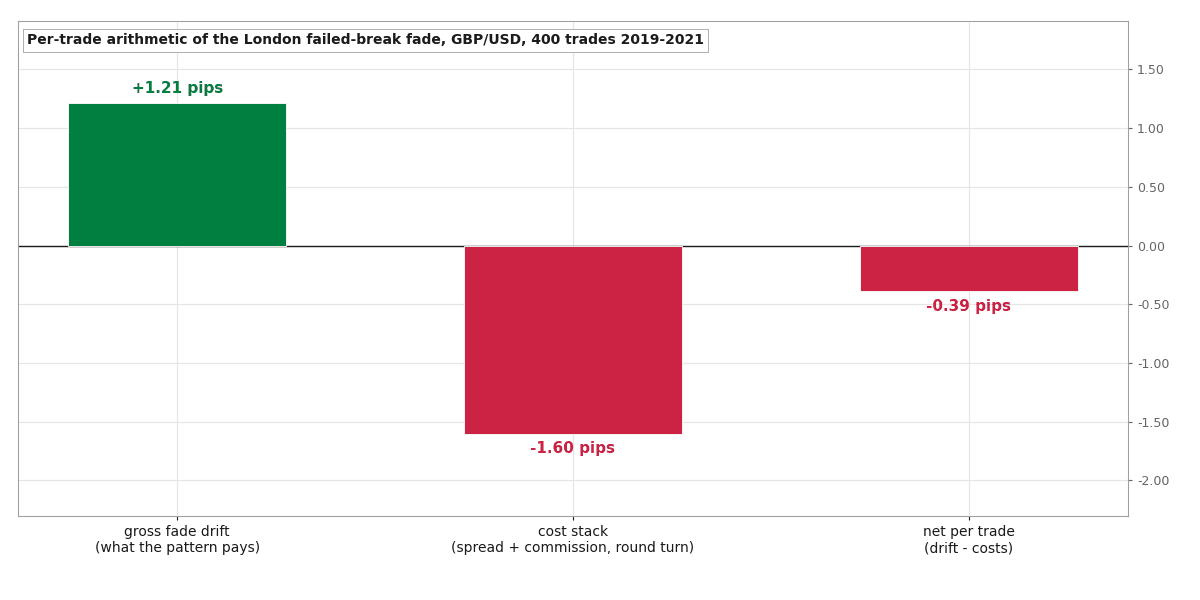
Many trading teachers show the London-open failed breakout trade. We measured 400 of them on GBP/USD tick data with the real spread. The price does move back, by about 1.21 pips before costs. But each trade costs 1.6 pips. The pattern is real, but there is no profit.
The 9:30 Opening-Range Breakout Is Just Long the Market in Disguise
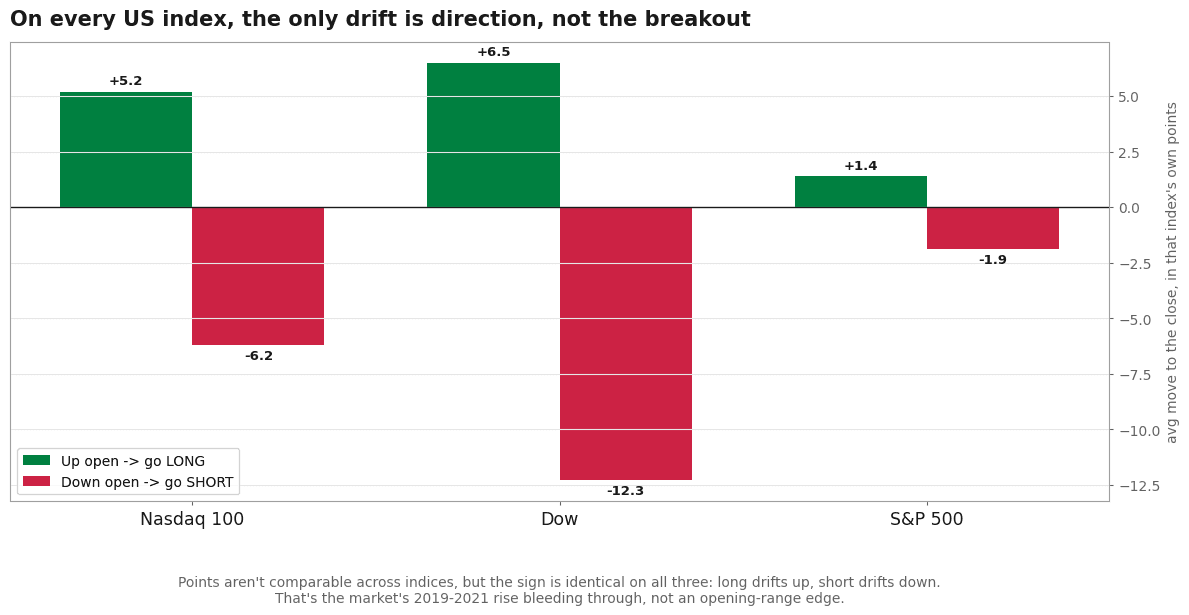
Everyone posts the 9:30 candle. We tested it on three years of 1-minute data for all three big US indices, before writing any EA code. When price closes outside the opening range, it does not keep going in either direction, on any index. The only profit came from buying a market that was going up.
Sixteen Strategies Failed Our Gates. The Four Best Losers, Combined, Passed Everything.
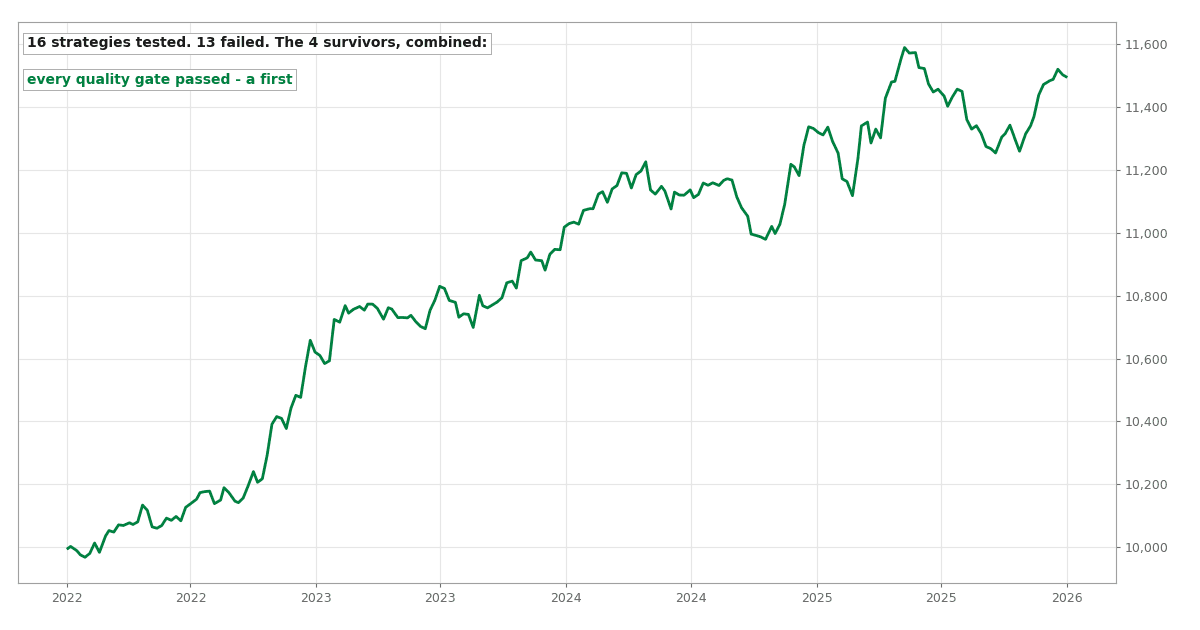
We tested 16 published trading strategies on real tick data. Four had a real edge but failed our tests on their own. We combined them with weights we chose before the test. Together, they pass all 14 of our tests.
Gold Really Does Rise Overnight. We Couldn't Keep a Cent of It.
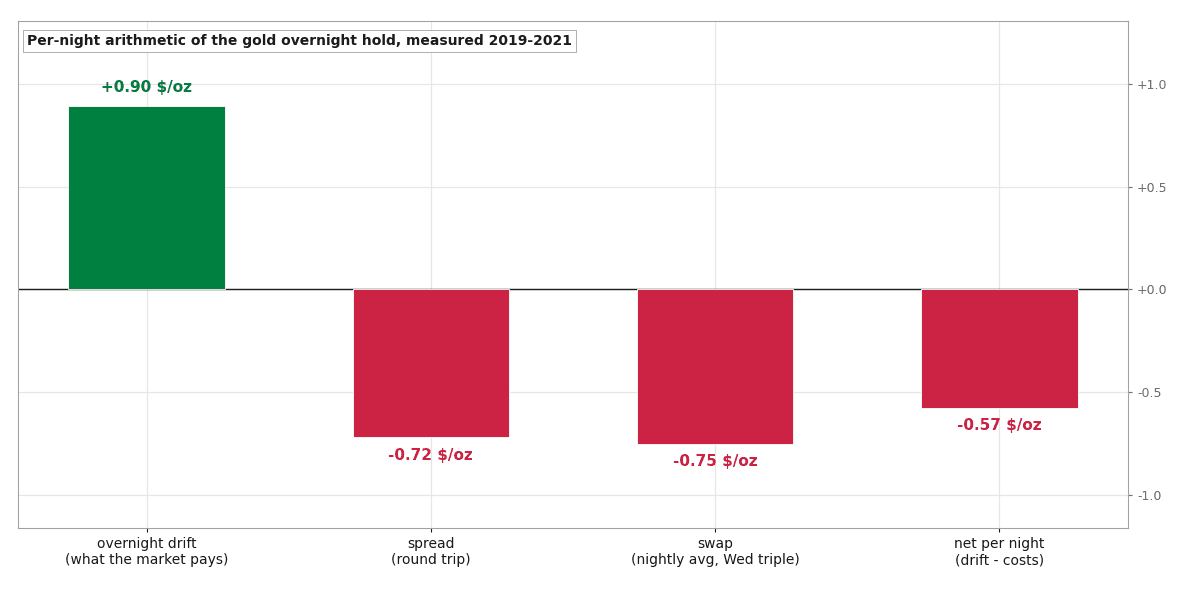
The 'London bias' says gold makes its gains between the PM fix and the next AM fix. We checked it on raw tick data and it is true: +$0.90 per ounce per night. Then we tried to trade it. The costs were $1.47 per night.
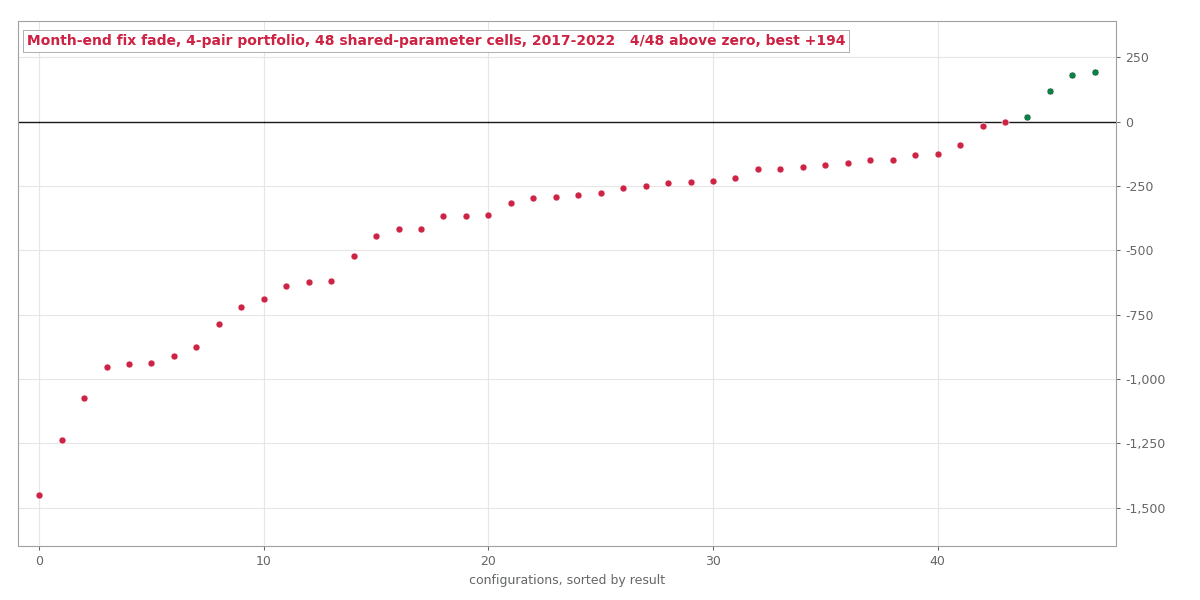
We Reopened a Closed Case With Better Tools. The Case Stayed Closed.
We tested trading the London 4pm fix on the last days of each month, on four FX pairs together, with new portfolio tools we did not have before. The best setting over five years made 41 cents per trade.
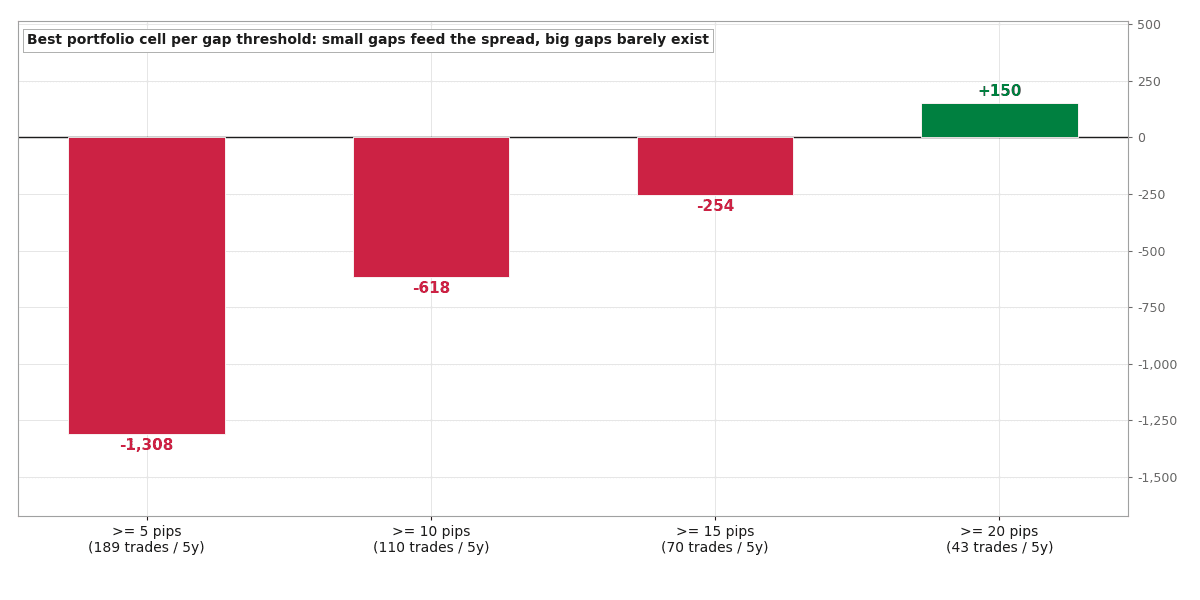
The Weekend Gap Really Fills. Your Broker Opens Too Late to Catch It.
People say forex weekend gaps close 70-86% of the time. That is true. But your broker shows prices on Sunday night and only lets you trade on Monday. By Monday, most gaps are already closed.
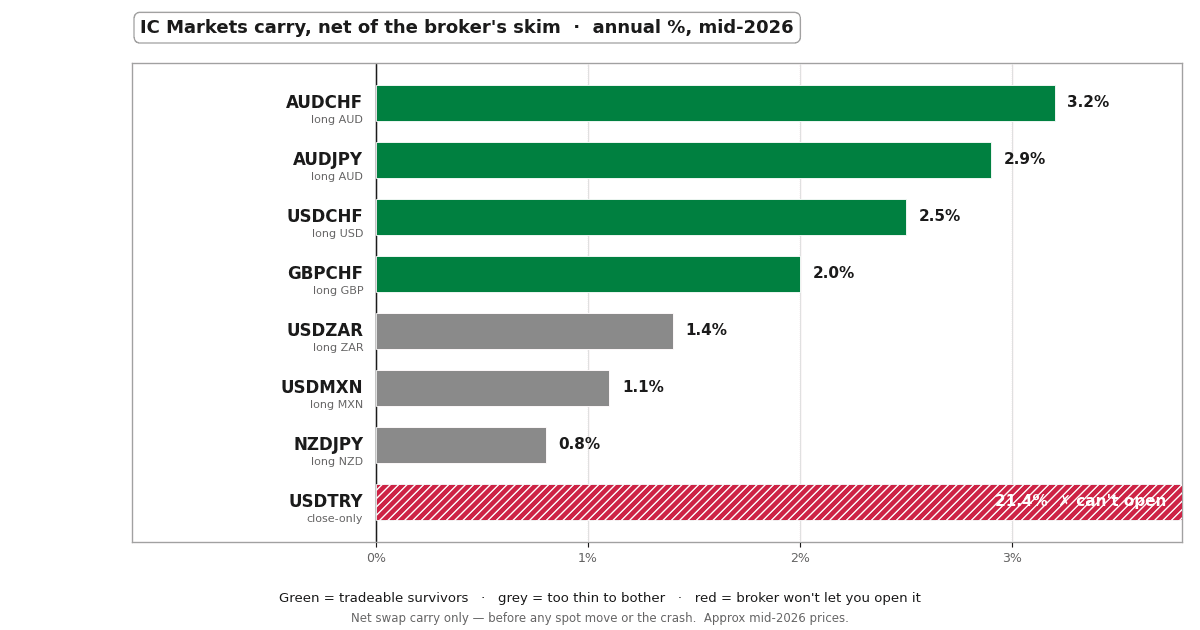
The Carry Trade We Killed in an Hour, Using Only the Broker's Own Swap Table
Before writing any code for a carry strategy, we read IC Markets' real swap rates for eight pairs. After the broker's cut, the big interest gaps became very small. And the pair that pays the most is one you are not allowed to open.
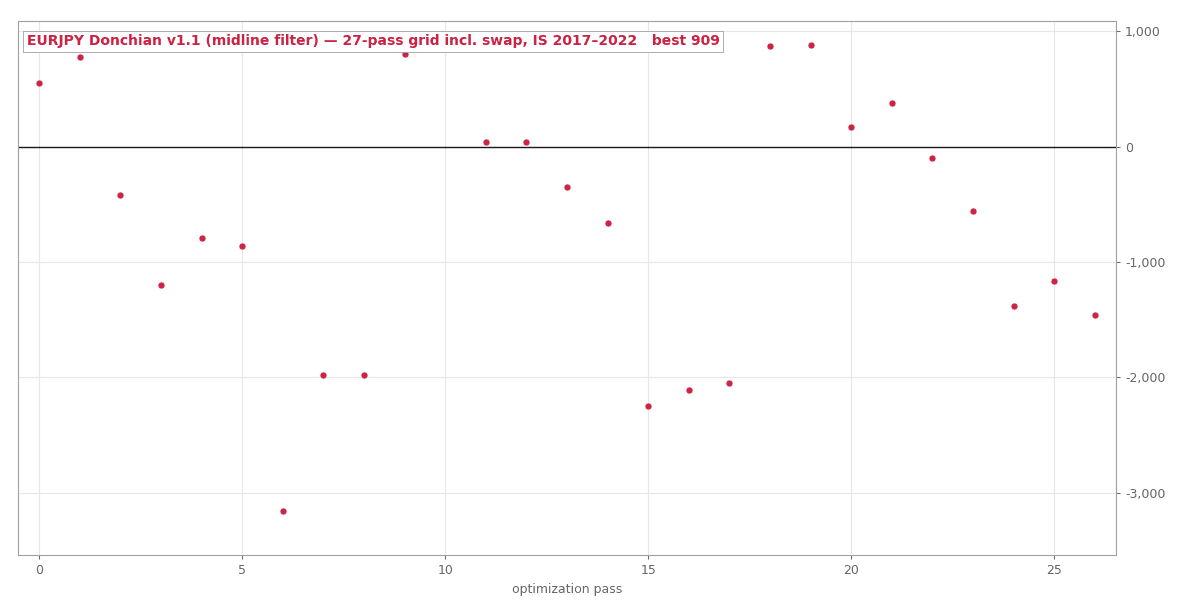
We Gave a Trend System Five Years of Sample. It Gave Back a 1.17 Profit Factor.
This is the first test with our new 5-year test period for slow trend strategies. EURJPY channel breakouts have a small real edge, but never enough to pass. The filter that helped Bitcoin made EURJPY worse.
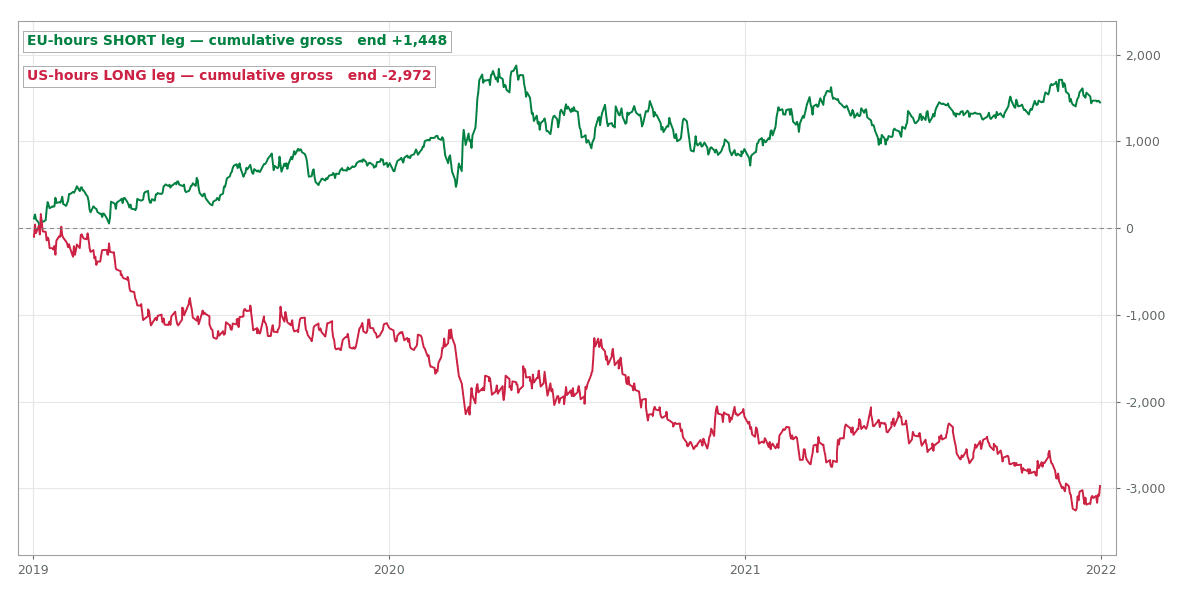
Half of a Journal of Finance Effect Is Still Real. It Pays Less Than the Commission.
Top research journals say a currency tends to fall during its own country's trading hours. We tested this on EURUSD tick data. The European part still works, at 0.75 pips per trade. But the cost is 0.7 pips.
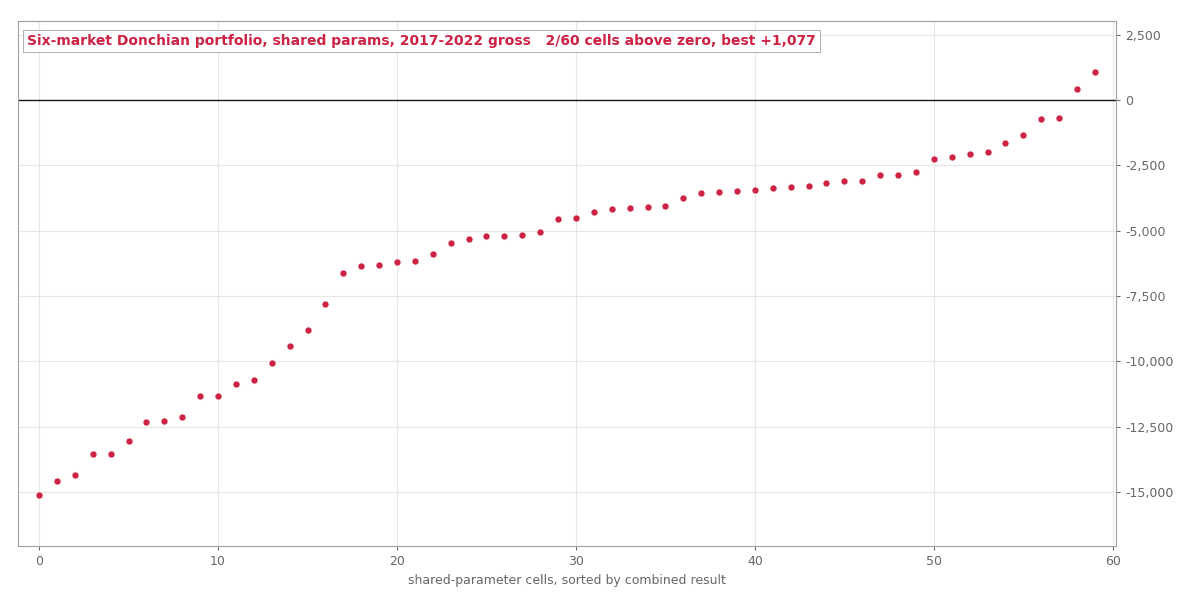
We Tested the Best-Evidenced Idea in Finance at the Scale a Retail Trader Can Reach
Man Group and AQR say trend following works because it trades many markets. Each market is weak, but together they make a good portfolio. We tried this with the six markets a normal retail account has. 58 of 60 settings lost money.
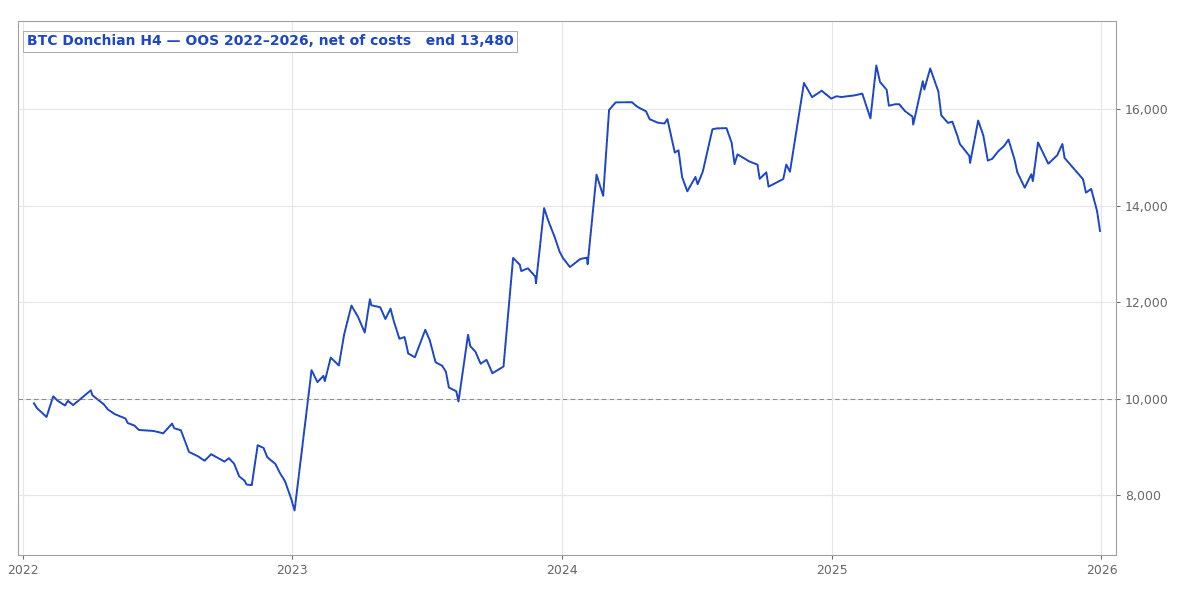
A Bitcoin Trend System Made $5,380 on Unseen Years. We Still Won't Trade It.
We tested a Bitcoin Donchian breakout with a real broker's $5 spread, not the data vendor's $50-115. It made $5,380 on four new years of data. But it still failed three of our quality checks, and a realistic drawdown is near 30%.
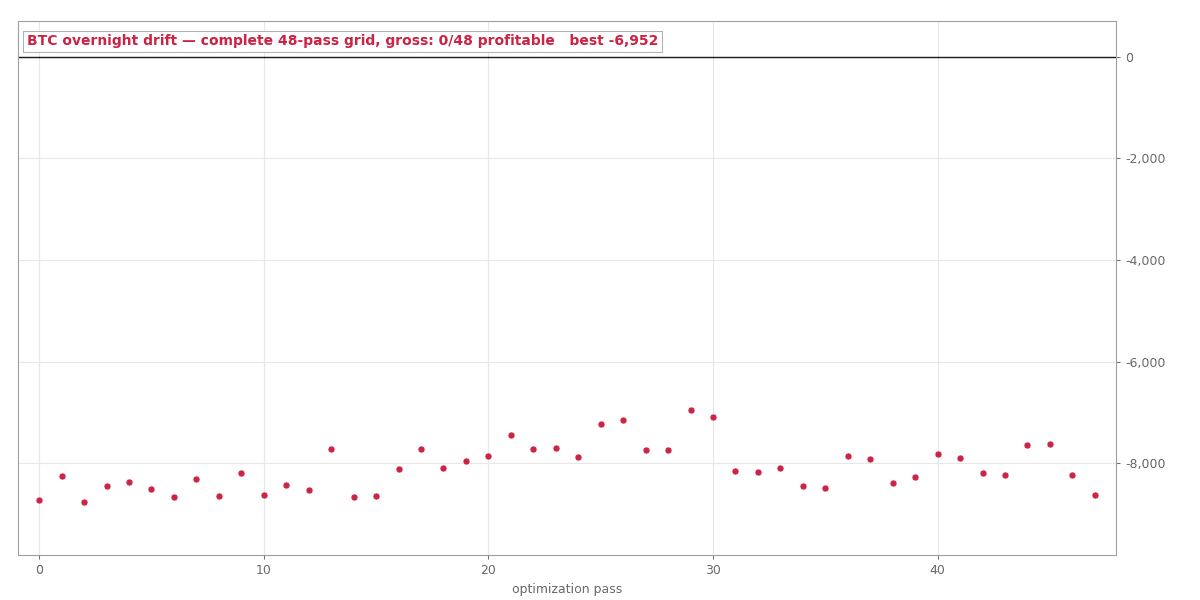
The Bitcoin Overnight Drift Is Documented at 33% a Year. At Real Broker Costs It Barely Breaks Even.
A published Bitcoin pattern makes 33% a year on exchange data. We measured it again with a real broker's costs. The 22:00 UTC rule lost money, because there was almost no price move at that hour. When we timed it to the New York close, it made about 0.04% per trade.
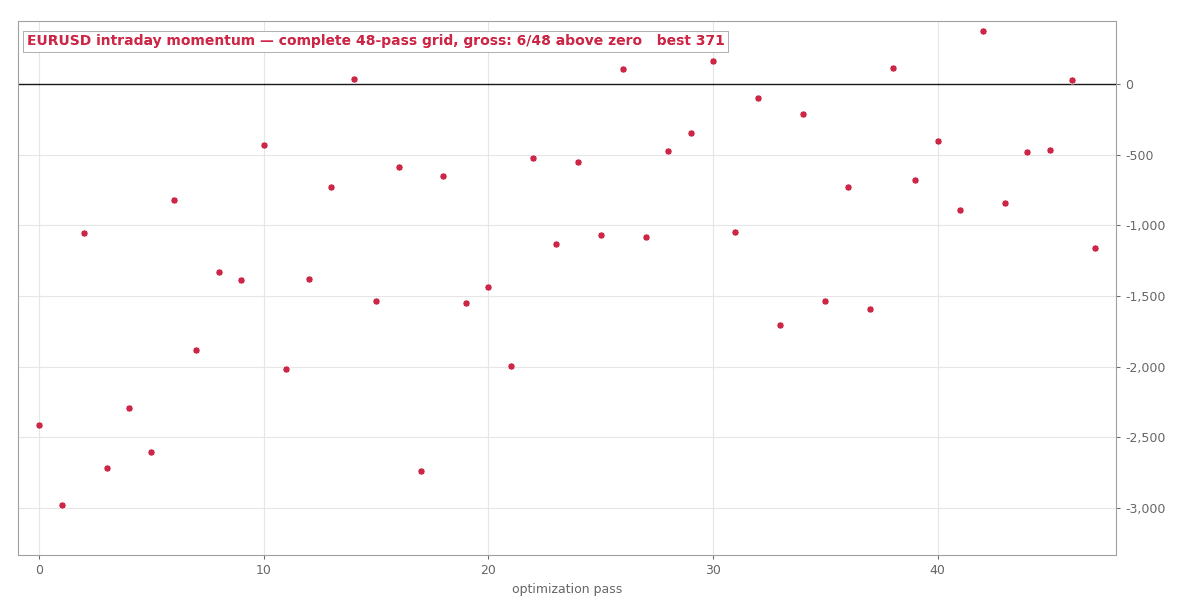
We Transferred an Academic Momentum Effect to EURUSD. The Market's Most Efficient Pair Said No.
Research shows intraday momentum in stocks and in RUB-USD. We tested it on EURUSD after 2019. The best of 48 settings made only $371 in three years. The idea failed on a new market, and trading costs were not the reason.
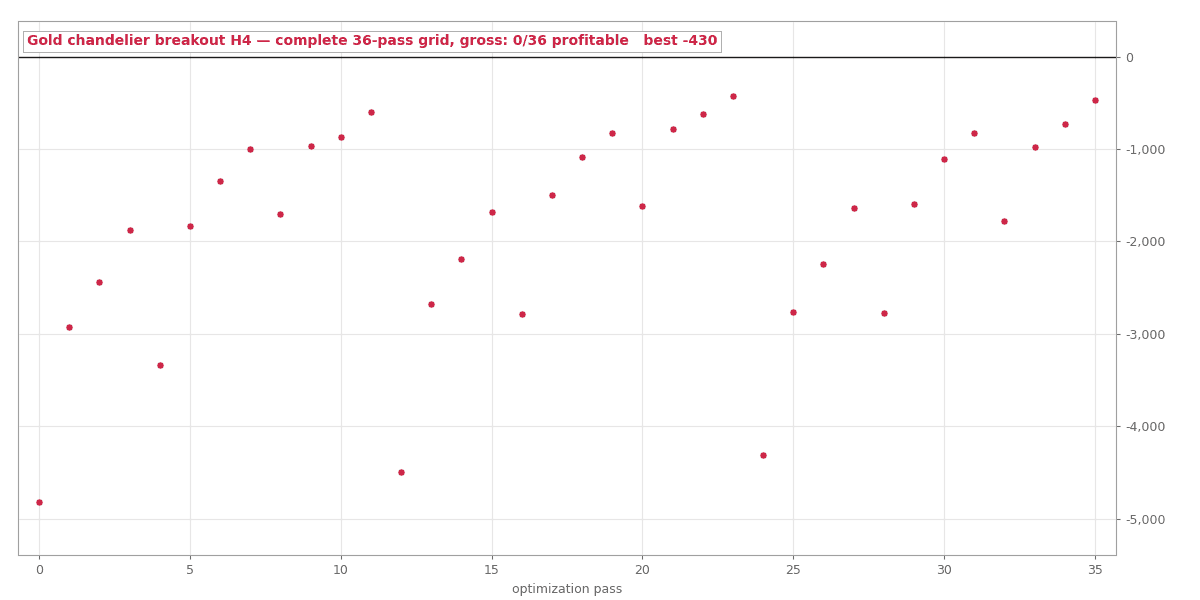
A Gold System With 28 Years of Published Results Met Our Tester. The Gradient Told the Real Story.
A gold breakout system with a trend filter claims a profit factor of 1.85 over 28 years, with costs. Our best test got 1.14 over 104 trades. Results got better each time we made the system slower. But the edge seems to live at a speed too slow for us to test properly.
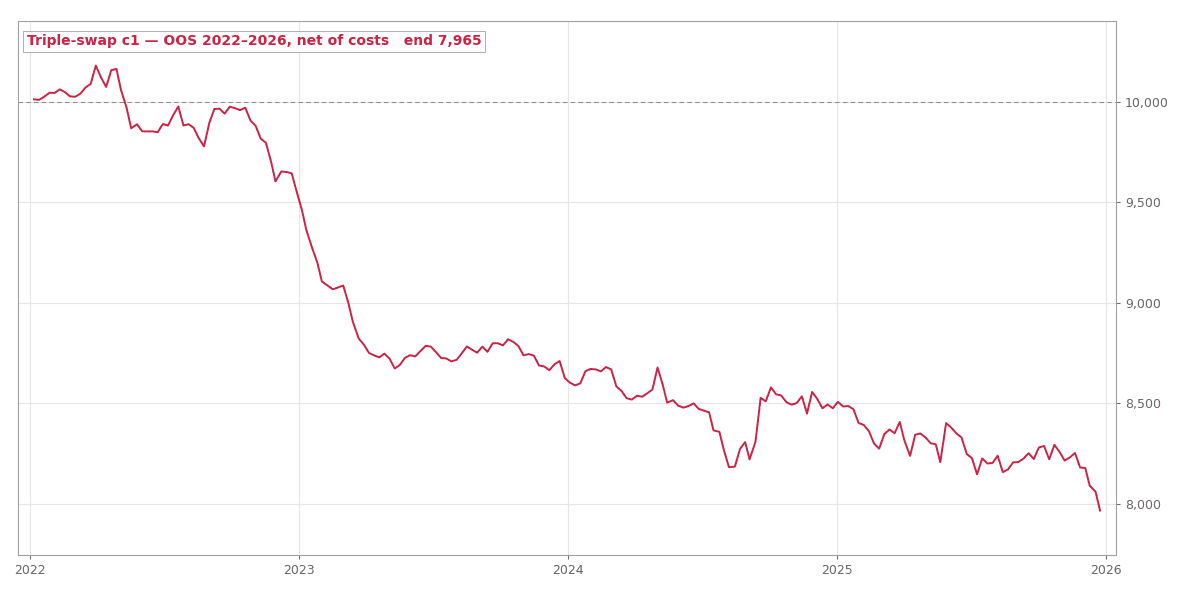
The Triple-Swap Strategy, Finally Backtested With Real Swaps: the Carry Is Real, the Trade Is Not
Many brokers and forums say you can collect three nights of USDJPY swap every Wednesday while holding the trade for only a few hours. We tested it with real swaps. The swap was paid every week. The strategy still lost money.
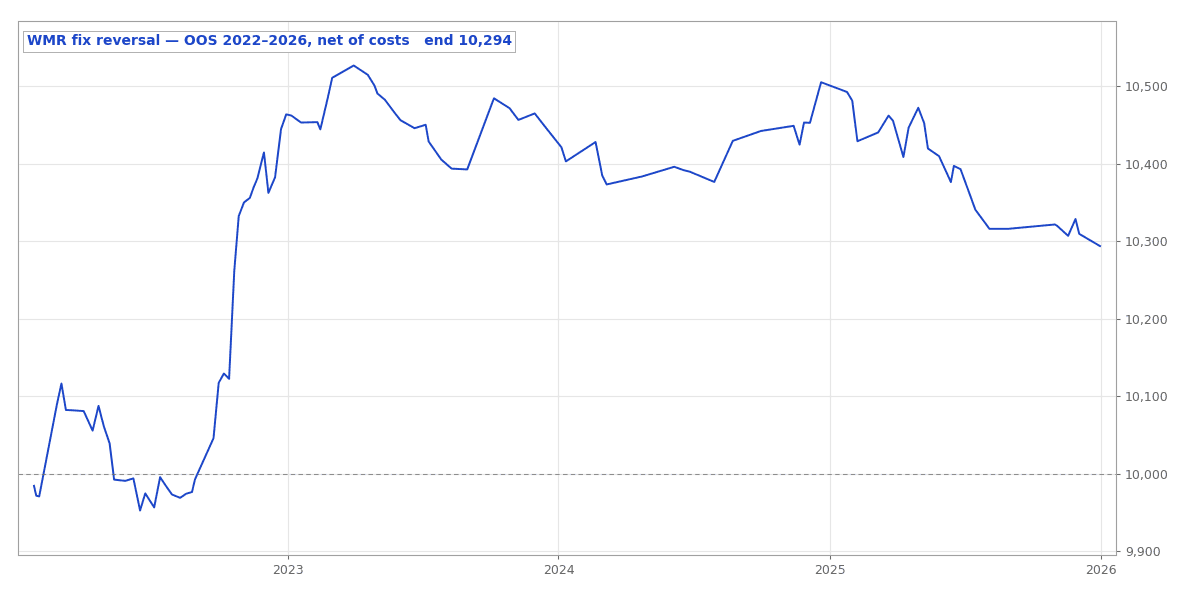
The London Fix Reversal: a Real Anomaly That Pays Less Than a Savings Account
We tested the WM/R 4pm fix reversal on 7 years of GBPUSD tick data. It passed 11 of our 12 tests, and we still said no. The one test it failed is the one that matters most.
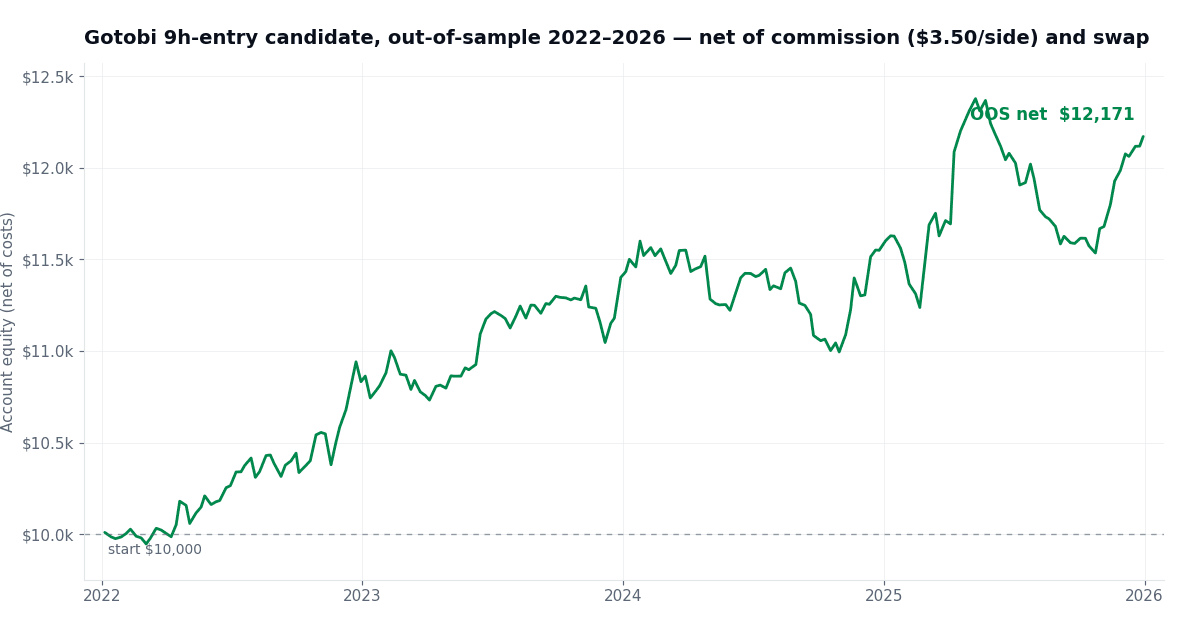
The Tokyo Fix Anomaly: a Real Edge That Still Didn't Make the Cut
We tested the famous 'gotobi' pattern on USDJPY with 7 years of tick data. The pattern is real, and we still rejected it. Here is the whole story, including the two versions that failed on new data.
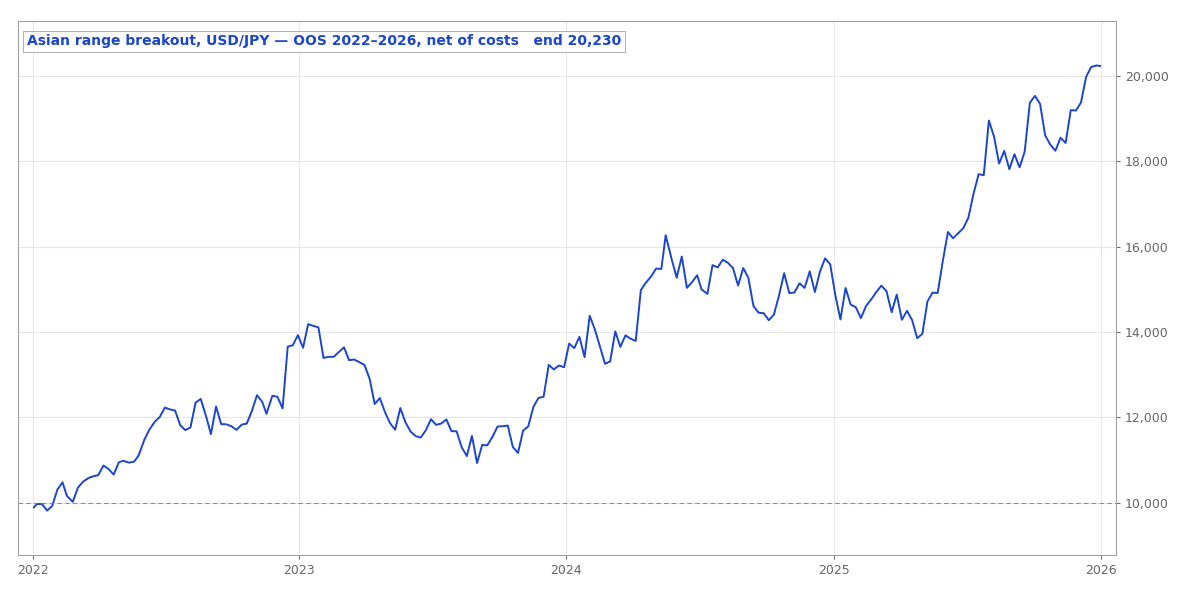
We Finally Tested Our First Strategy the Hard Way. The Edge Held.
The Asian-session breakout that started this project was only tested on the same data we used to tune it. So we ran our full set of checks: new unseen data, double costs, 10,000 random replays, and a test against simple strategies. It passed all four.
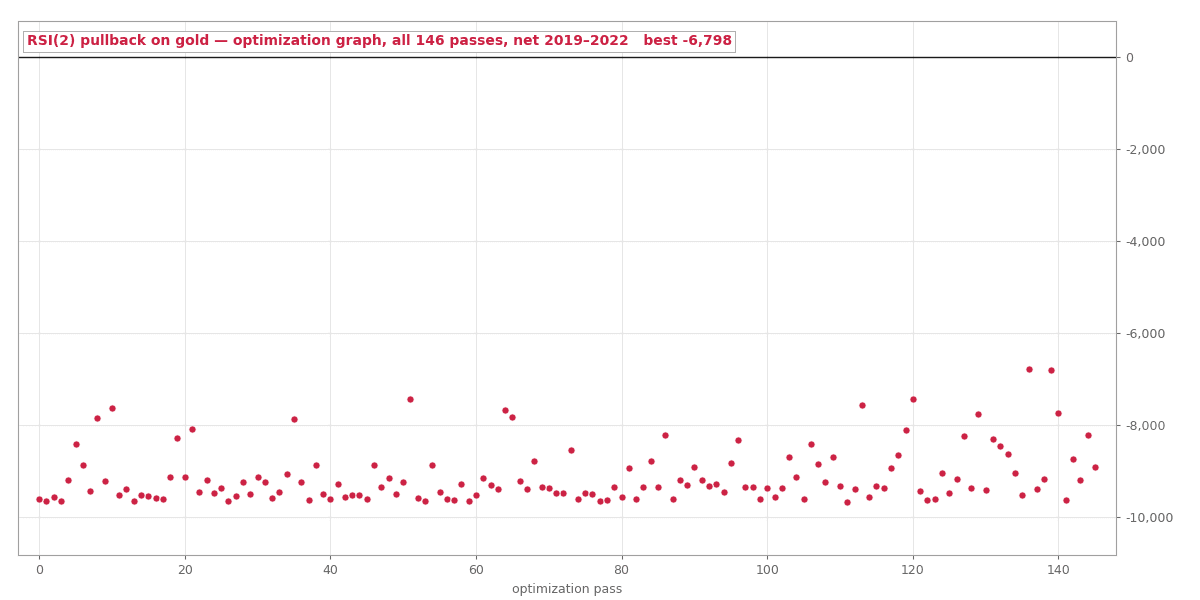
Every Configuration Lost Money: RSI(2) Mean Reversion Meets Gold
We took a well-known strategy that works on daily stock charts and tested it on the 1-hour gold chart. We used three years of tick data with real costs. Every setting lost money, and the reason is simple: the wins are too small to pay the costs.
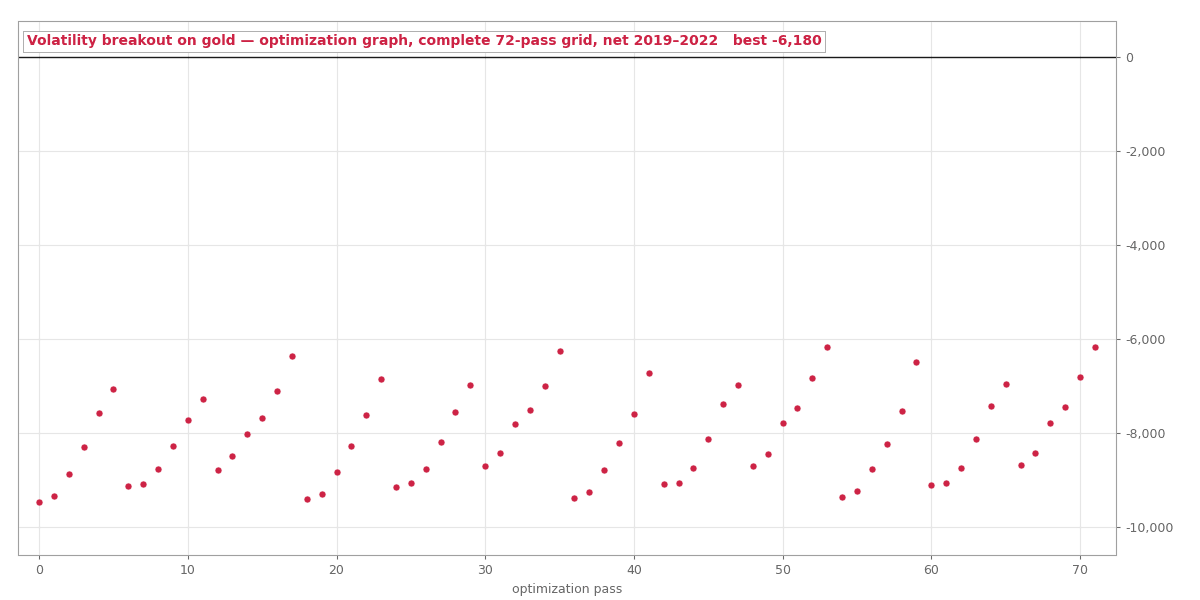
The Backtest Claimed +60% in 11 Months. The Real Number Is Closer to 5%.
A gold strategy was published with a great backtest: +60% in 11 months. We tested the same rules on seven years of real data with real costs. The edge is real, but it is about five times smaller than the claim, and half of it came in one year.