Turnaround Tuesday Measured at 6x Its Costs. Our EA Lost $40 Trading It.
We tested the Turnaround Tuesday rule on the S&P 500, Dow and Nasdaq 100. Measured at one lot per trade it paid about six times its costs. Traded with normal position sizing, the same rule lost money.
Turnaround Tuesday is one of the oldest calendar patterns in stock trading. When a US index closes down on Monday, you buy at the close and sell into Tuesday, because it tends to bounce.
We tested it on the S&P 500, the Dow and the Nasdaq 100, and the bounce is there. Measured on its own, it paid about six times its trading costs. Then we let an Expert Advisor trade the same rule the way most retail traders would, and it lost money. The gap between those two results is the interesting part, and it isn't in the signal.
Where the pattern comes from
The public version of the rule comes from QuantifiedStrategies: if Monday closes at least 1% below Friday, buy at Monday's close and sell at Tuesday's close. On SPY they report 212 trades, a 56% win rate and +0.30% per trade. Their free write-up doesn't say whether costs are included.
There is also a plausible reason for it. Investor mood follows the week: in a 2018 paper in the Journal of Financial Economics, Justin Birru showed that sentiment is lowest on Mondays and highest on Fridays. If gloomy sellers pile into a down Monday, whoever buys from them gets paid when prices recover. The weekend effect has been studied since Frank Cross in 1973 and Kenneth French in 1980, so this isn't a shape someone spotted on one chart.
How we tested it
We used S&P 500, Dow and Nasdaq 100 CFDs on one-minute data from 2019 to 2021. That's our in-sample window, the years we're allowed to look at. 2022 to 2026 stays untouched until a strategy has earned its one run there.
Every entry and exit sits at the 16:00 New York cash close, with US daylight saving handled, so the CFD price lines up with the index close the pattern is about. The three indices trade as one portfolio with a single shared rule set, because one index only produces 20 or so down Mondays a year.
Costs are what a retail account pays at IC Markets today. Index CFDs carry no commission there, but you pay a spread and a financing charge for every night you hold:
| index | spread per lot | overnight financing per lot, per night |
|---|---|---|
| S&P 500 | $0.75 | $1.73 |
| Dow | $1.05 | $12.01 |
| Nasdaq 100 | $1.50 | $6.81 |
Step one: is the bounce real?
Before writing any EA code, we measured the effect straight from the price data. One lot on every Monday that closed down at least 0.25%, held for one night, costs subtracted.
- 133 trades across the three indices
- an average gross move of +0.55% per trade, with 58.6% winners
- after spread and financing, about six times the costs
- positive in all three years
It also survives the obvious objection. March 2020 was the best stretch by far: the five biggest winners all came from that month and made up about a third of the whole winning move. Take out February to May 2020 entirely and the rest still pays roughly two and a half to three times its costs.
A second script, written separately with its own way of reading the closing prices, came out at 5.9 times costs against the first one's 6.4. Close enough that we trust the effect.
The exact rules of every strategy we've put on trial, how we tested each one, and what the data showed. 12 case files so far, free with your email.
Step two: trade it with normal position sizing
An EA doesn't buy one lot every time. Ours risks 1.5% of the account on each trade, with a stop three times the daily average true range away. That's a sensible way to trade, and it's how most retail EAs size their positions.
Same rule, same three indices, same years, a $10,000 account split three ways:
| trades | net result | profit factor | |
|---|---|---|---|
| measured, 1 lot each time | 133 | about 6x its costs | n/a |
| traded by the EA, 1.5% risk | 121 | -$40.16 | 0.95 |
The rule that measured best lost money once an EA traded it.
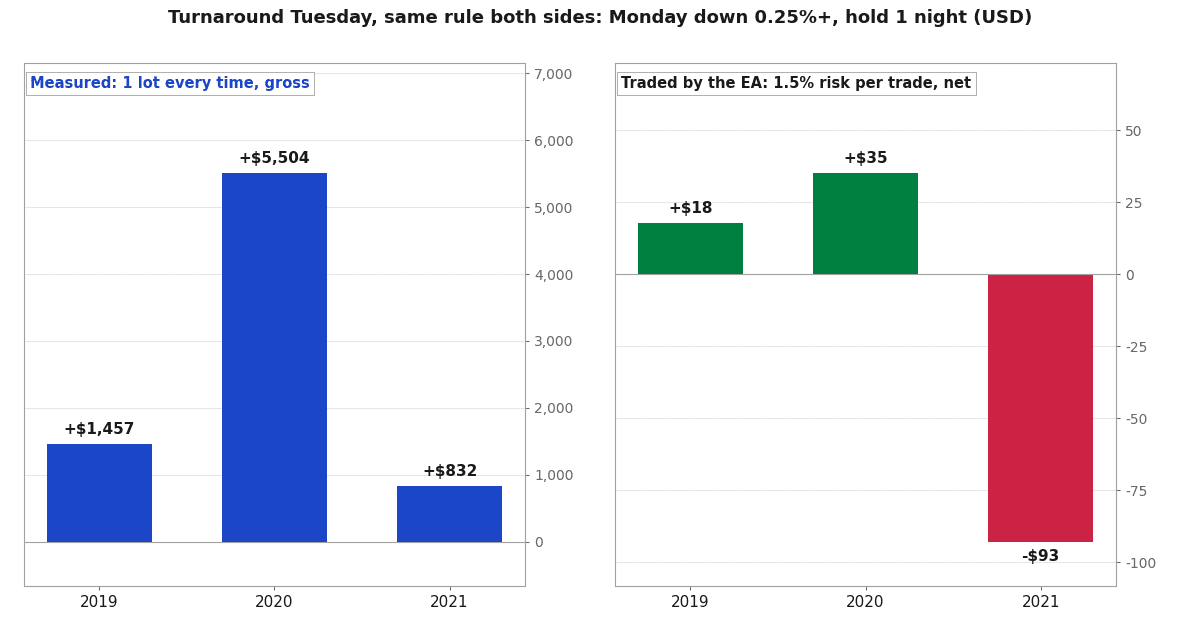
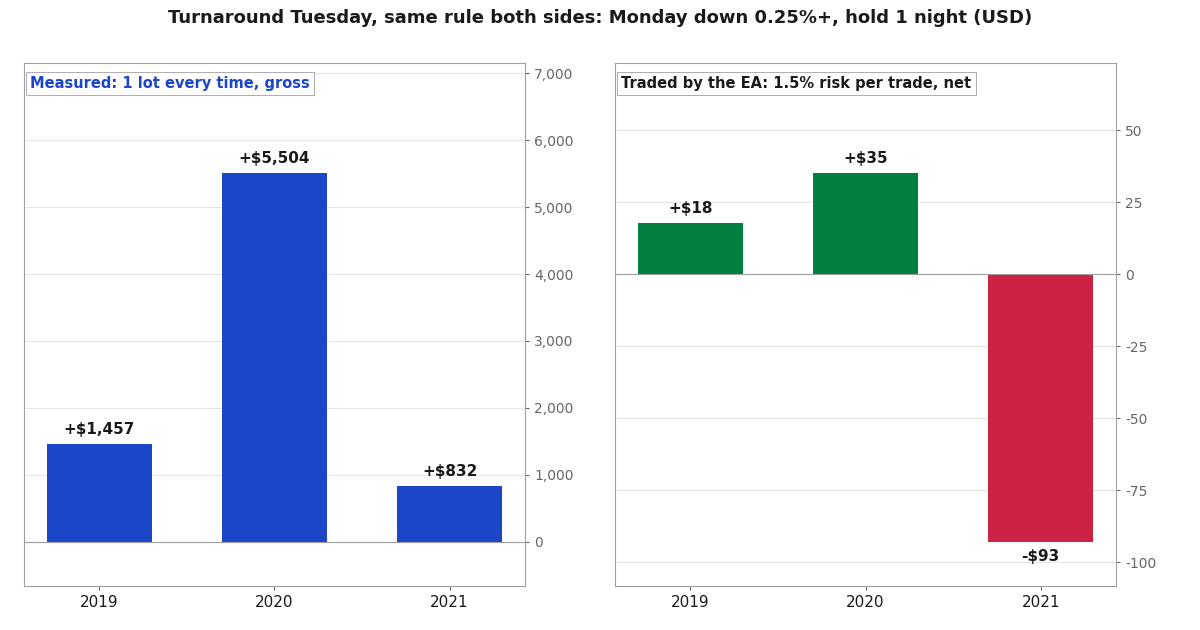 The same rule both sides, 2019 to 2021: Monday down at least 0.25%, hold one night. Left: measured at one lot per index every time, gross, USD. Right: traded by the EA at 1.5% risk per trade on a $10,000 account split across the three indices, net of spread and financing, USD.
Look at 2020. It was the best year for the effect by a wide margin, and the EA made $35 in it.
Why the edge disappeared
The first problem is position sizing. The biggest rebounds follow the most violent Mondays, and that's exactly when the daily range is widest. A stop based on that range sits far away, so a fixed 1.5% risk buys only a small position. The trades that carried the effect, like the March 2020 bounces, got the smallest size. On some of those days even the smallest position the broker allows was too big for the risk budget, which is part of why the EA took 121 of the 133 down Mondays.
The second is overnight financing, which is expensive on index CFDs. On the one-night rule the EA's gross profit was $67.48, and financing alone came to $84.44. One caveat on that: we charged today's rates for every year, which works out to about 10% a year of today's index prices. Rates were close to zero in 2020 and 2021, so a trader back then paid less. Someone starting this now pays today's rates, though, and that's the question we wanted answered.
The best version we could find
Next we let the optimizer search the in-sample years for the setting that held up best. We only accept a setting whose neighbours also work, so one lucky combination can't win. Exactly one area qualified: buy after any down Monday and hold for three nights.
It made $150.45 over three years on $10,000, from 162 trades, a profit factor of 1.10. Our minimum for an in-sample candidate is 1.30, so it failed.
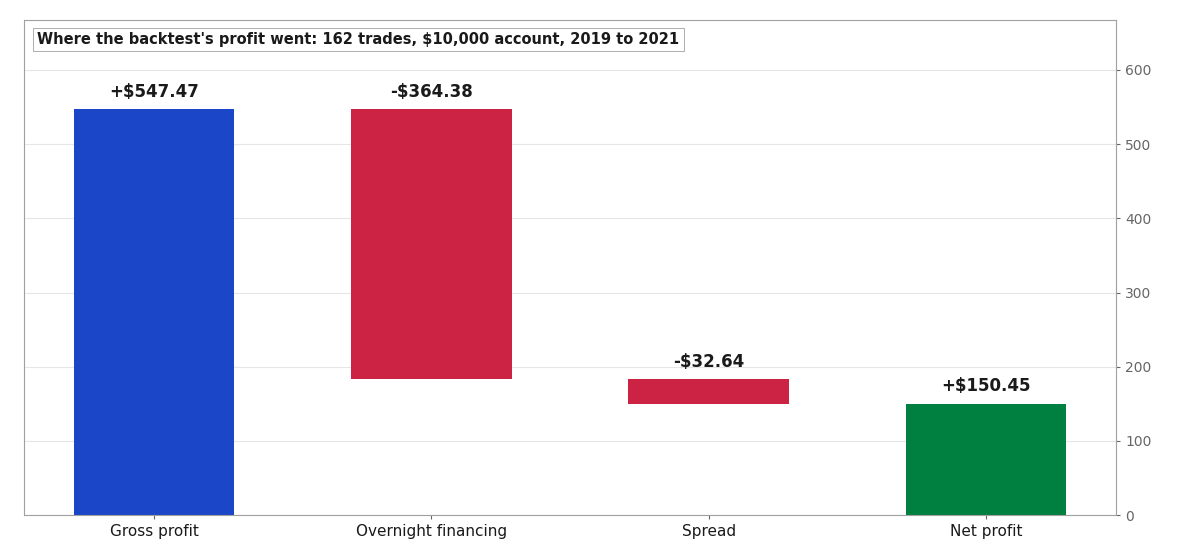 Where the best setting's profit went over 162 trades: gross +$547.47, overnight financing -$364.38, spread -$32.64, net +$150.45.
Three nights means paying financing three times, and it took two-thirds of the gross profit. The indices also disagreed with each other. The Nasdaq 100 made money on its own, the Dow lost, and the S&P 500 roughly broke even. A portfolio rule that only works on one of its three markets isn't the pattern we set out to test.
Because it failed in-sample, we never ran it on 2022 to 2026. Those years stay untouched for this idea.
What this means if you trade it
The bounce after a down Monday shows up in the price data, across three years and three indices. What we couldn't do was keep it in a retail CFD account with sensible risk management.
If you want to try it yourself, change the two things that broke it here. Size every trade with the same amount of money instead of scaling down when volatility is high, so the big rebound days get full size, and be honest with yourself about what that does to your risk on those days. And hold it somewhere without a nightly financing charge, such as an ETF in a cash account or futures. We haven't tested either version, so treat them as ideas rather than results.
Most backtests you'll find of this pattern use a fixed size and leave out financing. Put those two back in and, on our numbers, the edge is gone.
The exact rules of every strategy we've put on trial, how we tested each one, and what the data showed. 12 case files so far, free with your email.
Run the numbers yourself
The free calculators behind the sizing and robustness checks in this test. No signup.