The "Liquidity Grab" Fade, Measured: a Real Pattern That Loses a Third of a Pip Per Trade
Many trading teachers show the London-open failed breakout trade. We measured 400 of them on GBP/USD tick data with the real spread. The price does move back, by about 1.21 pips before costs. But each trade costs 1.6 pips. The pattern is real, but there is no profit.
Does fading a London-open failed breakout (the 'liquidity grab') work?
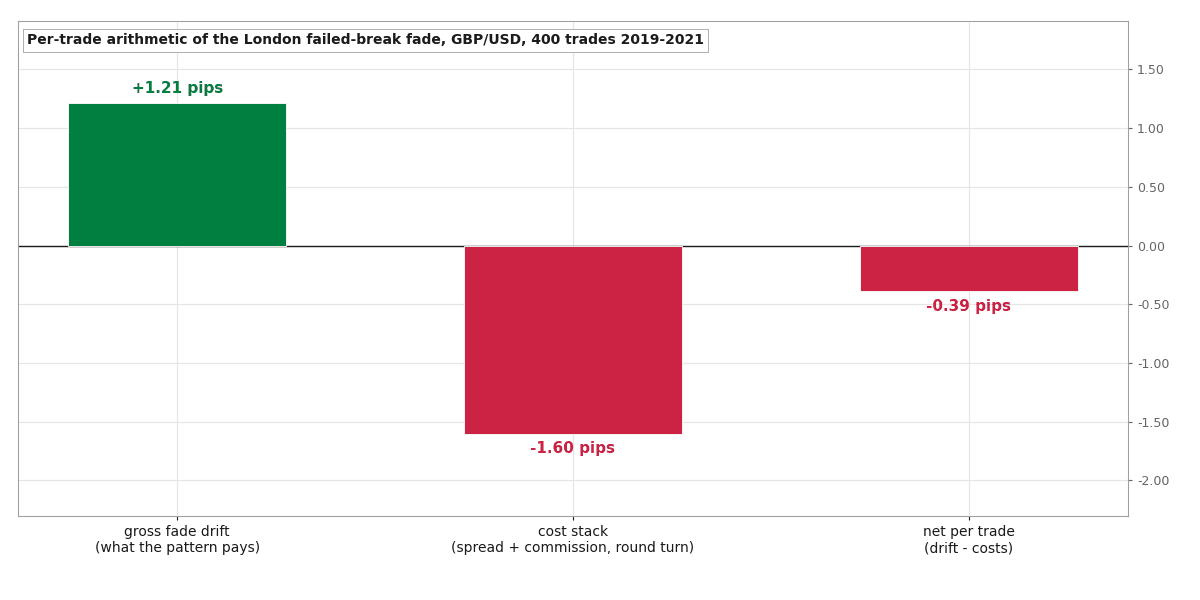
The move back is real, but it is too small to trade. In 400 setups on GBP/USD from 2019 to 2021, it made about 1.21 pips per trade before costs. Each trade cost about 1.6 pips. So you lose 0.39 pips per trade.
What is a "liquidity grab"?
If you watch trading videos on TikTok, you probably know this setup:
- London opens.
- The price jumps above the overnight high (the highest price of the night).
- Then it quickly falls back inside the night's range.
Trading teachers call this a liquidity grab. Their story: many traders put stop losses (orders that close a trade to limit a loss) just above the high. The jump hit those stop orders. Now those orders are used up, so the price should move back. You trade against the jump. This is called fading it.
This idea has better support than most social media trading ideas. Carol Osler, a researcher at the New York Fed, showed that stop-loss orders gather just past price levels that everyone can see. She also showed that when the price hits those orders, you get this exact jump-and-return shape. The overnight high is the level that forex traders watch most. And the London open brings enough trading to reach the stops above it.
So the reason behind the pattern is real. But nobody who teaches it gives a number for how much it actually pays.
So before we wrote any code for a trading robot, we measured it.
The exact rules
If a pattern is vague, you cannot prove a backtest wrong. So we fixed every rule before the test:
- Range: the GBP/USD range from 03:00 to 07:00 UTC, before London opens.
- Setup: the first time in the day that the price closes above the range high, and then closes back inside the range within a few 15-minute bars. We use only the first try. If it does not fail cleanly, there is no trade that day.
- The trade: sell when the breakout fails.
- Take profit (the price where you exit with a profit) at the other end of the range.
- Stop loss at the highest point of the failed breakout.
- Close the trade after two hours at most.
- Data: real Dukascopy tick data (every single price change) from 2019 to 2021, with the real spread (the difference between the buy and sell price) and commission. Together, these costs are about 1.6 pips per trade (opening and closing). A pip is a very small price step, 0.0001 on GBP/USD.
What 400 trades really pay
With the strict rules, we measured 400 trades. That is about 133 per year.
"Gross" means before costs. "Net" means after costs. "Expectancy" is the average result per trade.
| Metric | Value |
|---|---|
| Trades measured | 400 |
| Win rate | 50.2% |
| Gross expectancy | +1.21 pips per trade |
| Cost per round turn | ≈ 1.6 pips |
| Net expectancy | −0.39 pips per trade |
| Take-profit reached inside the trade | 37.2% |
| By year, gross | 2019 +1.21 · 2020 +2.21 · 2021 +0.31 |
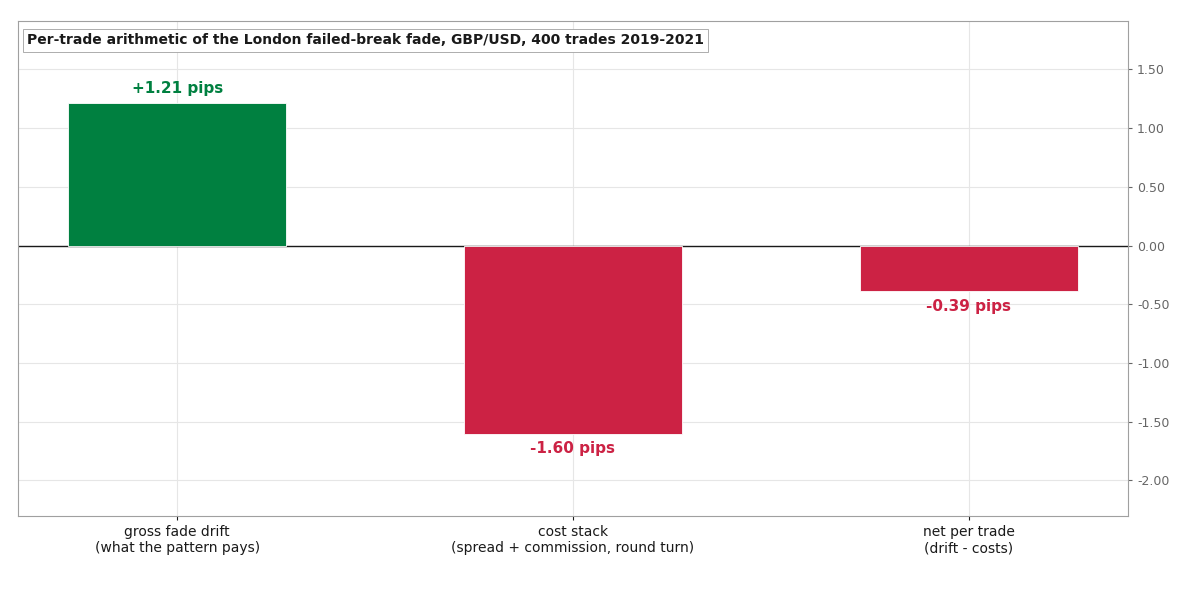 The whole trade in three bars: the move back pays 1.21 pips, the trade costs 1.6, and the trader keeps −0.39
Here is the uncomfortable part: the pattern IS real. After a failed breakout, the price really does move back, by about 1.21 pips on average. The trading teachers describe something that exists.
But it costs 1.6 pips to trade it. So you pay the market about a third of a pip on every trade, for as long as you trade it. The results by year also suggest that the move itself became smaller over time.
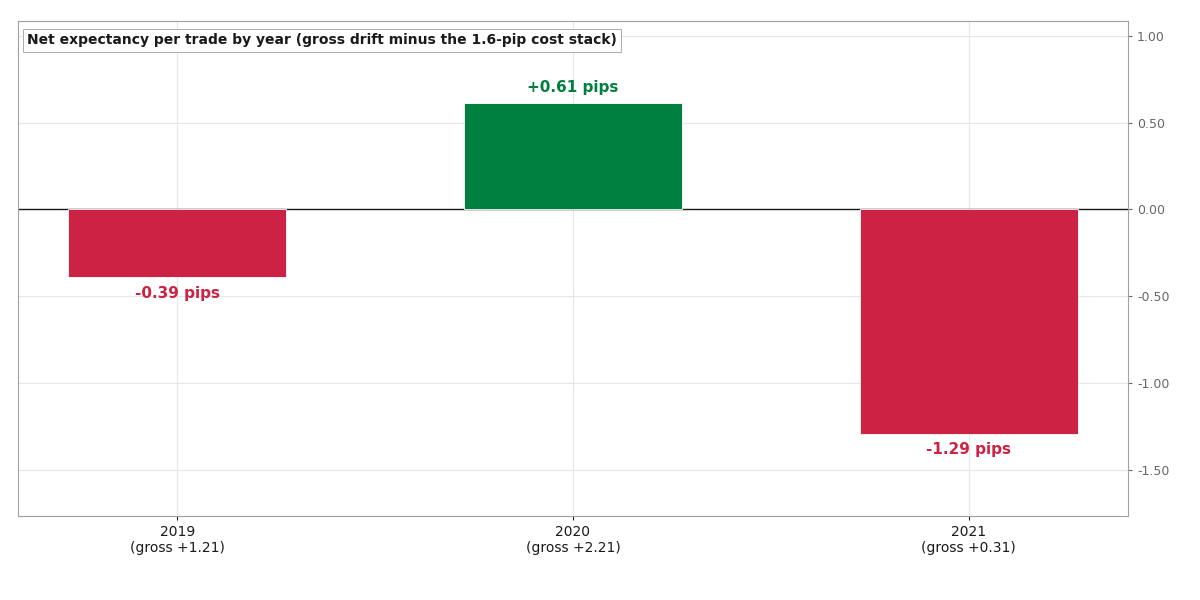 Net result by year: only 2020 was above the cost, at +0.61 pips; 2021 was −1.29
Only 2020 had a big enough move to pay the costs. That was the year of the pandemic, when every market moved a lot. If you build a robot on one special year, you get a strategy that looks great in the backtest and fails everywhere else.
The trap of choosing the rules that look best
Our first measurement gave a nicer result. In that version, we counted every close outside the range that later came back into the range. We also measured the move over a fixed two hours. That gave 502 trades paying +2.07 pips before costs. That is about 1.3 times the cost. In that version the strategy looked alive.
But that wide rule also counts long breakouts that slowly come back later. That is not what the idea says. The idea is about stop runs (quick jumps that hit stop orders):
- the FIRST try of the day,
- that fails within a few bars,
- traded with the pattern's own exit rules.
We could have kept the friendly rule because it made money. But then we would pick the rule that looks good on the data we have, and pay for it on future data. With every fair version of the rules, the edge you can collect is the same as the cost or smaller.
So we rejected it at the measurement step. We did not build a robot. We also did not use our hidden out-of-sample years (data we keep for a final test). The math was already clear.
How it fits with our other results
This result matches one we got from the other side of the same event. Our Asian range breakout strategy trades IN THE SAME DIRECTION as breakouts that close outside the range on USD/JPY. That strategy held up on new data and now runs on a demo account.
Put the two results together and you get one simple lesson:
- Breakouts from a session's range carry useful information on average. They are worth following.
- Failed breakouts are just noise. After costs, trading them is worth nothing.
Nobody sells this lesson. But it is the one the tick data supports.
These are backtests and measurements. They are not live trading results. This is not financial advice.
Case 003 in one PDF: the exact rules, how we tested them, and what we found. Your email unlocks it and the other 11 case files, plus every new one as it lands.
Run the numbers yourself
The free calculators behind the sizing and robustness checks in this test. No signup.