The Tokyo Fix Anomaly: a Real Edge That Still Didn't Make the Cut
We tested the famous 'gotobi' pattern on USDJPY with 7 years of tick data. The pattern is real, and we still rejected it. Here is the whole story, including the two versions that failed on new data.
Is the gotobi (Tokyo fix) anomaly on USD/JPY real?
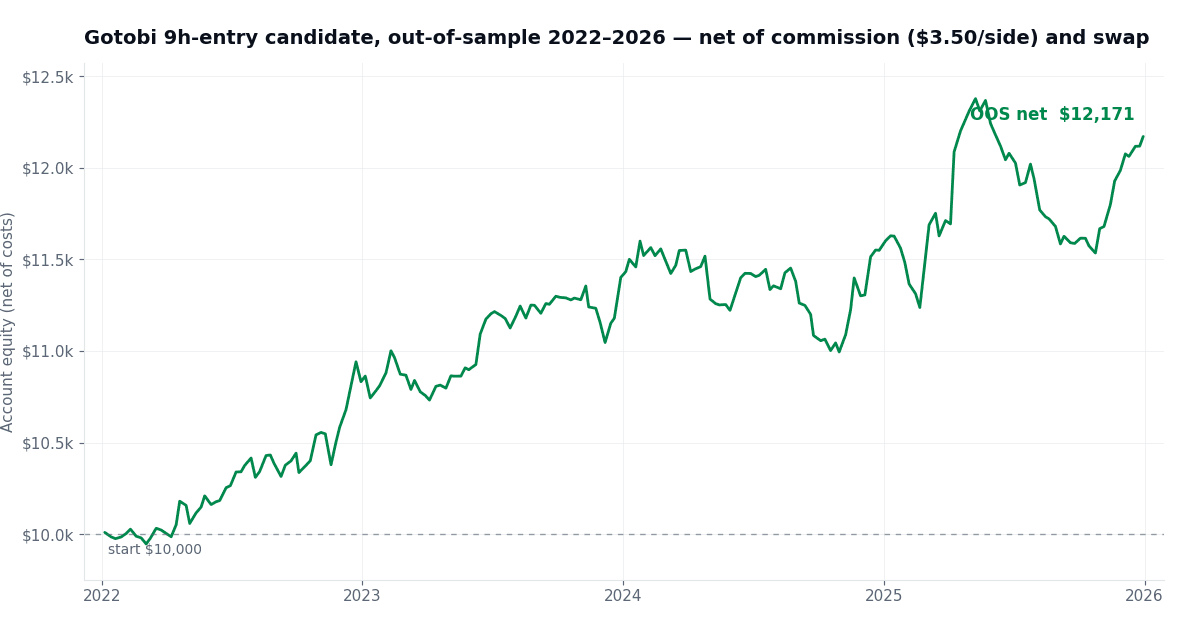
Yes. Buying nine hours before the 9:55 Tokyo fix gave a profit factor of 1.36 over 283 trades on new data from 2022 to 2026. We still rejected it as a strategy on its own. It kept 67% of its old profit factor, and our rule asks for 70%.
What is the gotobi effect?
Most trading patterns are stories without proof. The gotobi effect is different. It has real research behind it.
In Japan, many companies pay their bills on days that can be divided by 5: the 5th, 10th, 15th, 20th, 25th and 30th of the month. These days are called gotobi days. Japanese importers often pay in US dollars. So on these days their banks buy dollars before the Tokyo fix. The Tokyo fix is the official daily exchange rate, set at 9:55 in Tokyo (JST).
All this buying pushes USDJPY up in the hours before the fix on gotobi days. Ito and Yamada wrote about it in NBER working paper 22820, and arXiv:2301.13204 studied it again in 2023. The buying comes from real business payments, not from traders betting on prices. That is the usual reason people give for why the effect did not disappear after it became well known.
We chose it as the first test for our research process for simple reasons. The rules are clear and do not need judgment. The research is real. And Japan does not change its clocks in summer, so the fix is at 00:55 UTC all year. There is no time-zone confusion.
The rules we tested
- Trade only on gotobi days. If the date falls on a weekend, trade on the Friday before. This is how Japanese payments work.
- Buy USDJPY a number of hours (N) before the fix. N is the setting we optimized (tested many values to find the best one).
- One trade per fix. Buy only, never sell short.
- Close the trade at the fix, in profit or in loss. The buying pressure ends there.
- A fixed stop loss (the price where we close a losing trade). We tried 15 to 60 pips. Each trade risks 1% of the account.
How we tested it
- Data: Dukascopy tick data (every price change), with real-tick modeling.
- Account: $10,000 at the start. Commission included at $3.50 per side per lot.
- Finding the settings: we optimized only on 2019 to 2022. This is the in-sample period (the data used to choose the settings).
- Choosing safely: we did not just take the single best result. We took a setting only if the settings next to it also made money. This shows the result is stable and not a lucky accident.
- The real test: we kept 2022 to 2026 locked until we had fixed our choices. This is the out-of-sample period (new data the strategy has never seen). Each chosen version got exactly one run on it.
Three versions passed the selection. All three had a net profit factor above 2.0 in sample. (Profit factor = total money won divided by total money lost. Above 1 means profit.) Then the out-of-sample test judged them:
| Version | In-sample 2019-22 | Out-of-sample 2022-26 | Result |
|---|---|---|---|
| Buy 4h before fix | PF 2.10, +$1,295 | PF 0.79, −$1,130 | Failed |
| Buy 9h before fix | PF 2.04, +$1,668 | PF 1.36, +$2,171 | Real edge |
| Buy 8h before, tight stop | PF 2.10, +$4,125 | PF 1.03, breakeven | No edge after costs |
Two of the three failed
All three versions looked stable in sample. The settings around them also made money. They passed all our stability checks. But the 4-hour version, which looked the best of the three, still lost money over four years of new data:
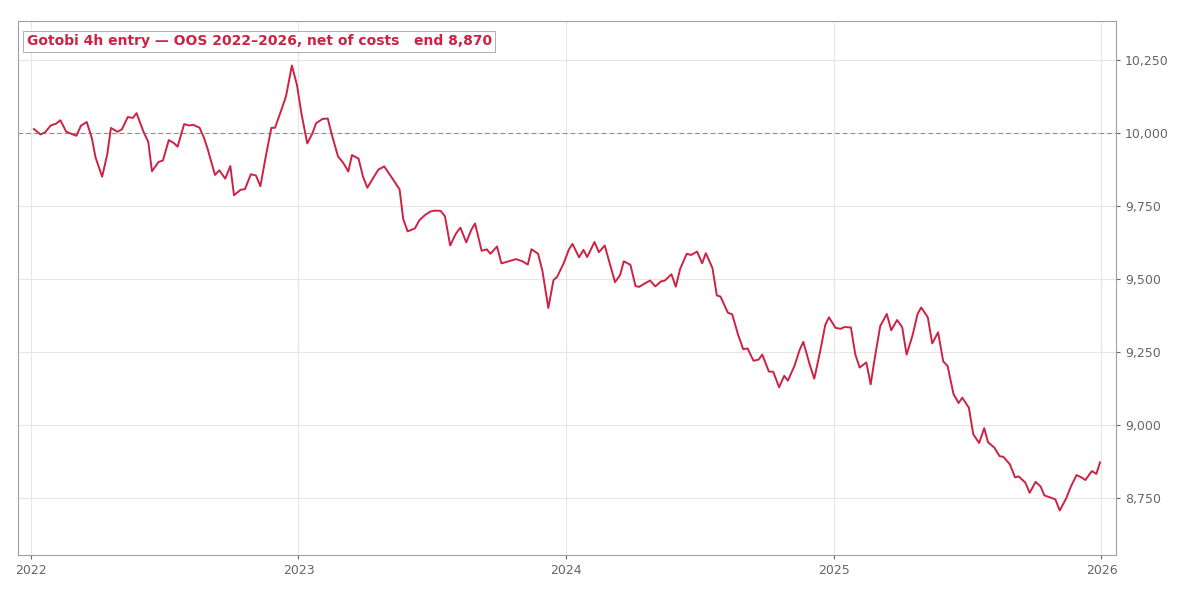 The 4h version on new data: what a result built from optimization alone looks like
Imagine we had published the 4-hour backtest in March 2022. It would have looked great. Then it would have lost money for four years. So a stable in-sample result is needed, but it is far from enough. We knew this in theory. Now we know it from a week of our own work.
One version worked, and we still rejected it
The 9-hour version kept a real edge on new data:
- Profit factor 1.36 over 283 trades
- +21.7% over four years, risking 1% per trade
- Maximum drawdown (the biggest drop from a high point) of 7.0%
- It still made money when we raised commission to $8.50 per side
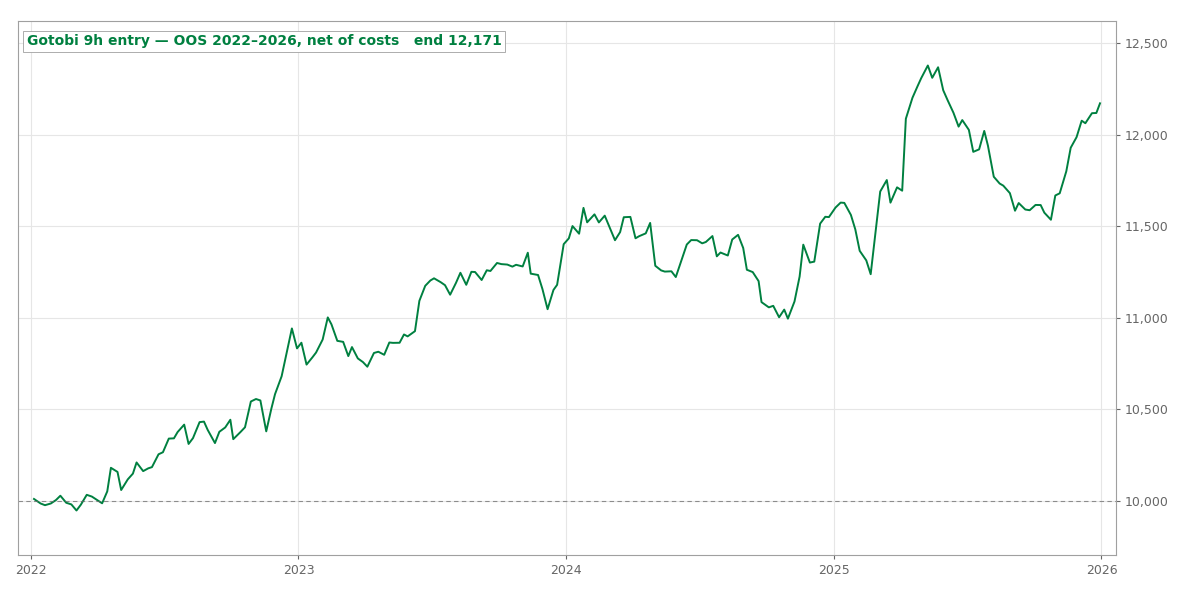 The 9h version on new data: a real but small edge
So why reject it? Our rule says a strategy must keep at least 70% of its in-sample profit factor on new data. This one kept 67%. We thought about it for a while. But if you lower the bar after you see the result, you are fooling yourself, and the record shows it. Skipping a small edge costs nothing. Trading live on a result that came only from optimization costs real money.
So the 9-hour version went to a demo forward test instead. Forward data means future prices, so nobody can fit a strategy to it in advance. If the demo looks like the out-of-sample result for a few months, we will look at the strategy again.
Case 004 in one PDF: the exact rules, how we tested them, and what we found. Free with your email.
How much of the profit came from swap?
A reader asked about this after we published. The reader was right to ask, so the answer belongs here in the post.
Every trade that stays open past the daily rollover holds USD/JPY overnight. Holding long USD/JPY pays a positive swap (the interest a broker pays or charges for holding a trade overnight). Swap was $554 of the $2,171 net profit. That is a quarter of the result.
There is a second problem. MetaTrader uses a symbol's current swap rate for the whole backtest. It does not use the rate that was true on each night. We read our rate in July 2026. It is about 2.5% a year, and the tester charged it the same way every day from 2022 to 2026. But the real interest rate gap between the dollar and the yen was near zero in early 2022. It was above 5% in 2023 and 2024. Brokers never pay the full gap. Still, one fixed number is wrong in both directions, depending on the year.
We had already written about this problem ourselves, in the post about killing a carry trade with the broker's swap table. But we forgot to check it on this strategy, which holds trades overnight every time. Knowing about a problem is one skill. Remembering to check for it is another, and it is the harder one.
Checking was easy. The tester shows swap in its own column for every trade. We set that column to zero. Without swap, the four years made:
- $1,618 net, or +16.2%
- Profit factor 1.26, win rate 51.9% (the share of trades that made money)
- Every year still positive: +$704, +$437, +$38, +$438
The price move is still the main source of profit: $28.45 per lot, against $7.34 from swap. Swap paid for about a quarter of the profit. It also paid for almost all of 2024. That is the weakest year in the record, and we want to say so clearly.
One result of this check goes against us, so we report it too. Without swap, the profit factor on new data keeps 74% of the in-sample value instead of 67%. That passes the 70% rule that rejected the strategy. We still keep the rejection. Changing the score after you can see which way the change goes is the same self-deception we described above. This time it would just make us look better.
We ran the winner 10,000 more times
The 67% number comes from one path through four years. Before we sent the 9-hour version to the demo account, we wanted to know two things. How much of the result was a real edge? And how much was luck in the order the trades came in? So we ran a simulation with the trades.
We asked two questions and ran each one ten thousand times:
- Take the 283 out-of-sample trades and pick trades at random from them, many times. A trade can be picked more than once. How often does the strategy end with a loss?
- Keep the exact same trades, but put them in a random order each time. How deep does the worst drawdown get when the losing trades come together?
Each run reshuffles the 283 out-of-sample trades, drawing them with replacement, and totals the result. The blue line is what actually happened; the shaded band left of zero is every run that ended in the red.
The edge did well in this test:
- Only 3.4% of the random runs ended with a loss.
- The middle run made about the same as the real one.
- The real drawdown was near the middle of the group, at the 67th percentile. So the real result was not just a lucky case.
- For the drawdown it took, its return was about 38% better than both buying and holding USDJPY and a simple 12-month momentum rule.
None of that saved it. By every measure we can check after the test, the strategy is sound. But it still missed the one rule we set before we looked: 67% profit-factor retention against a 70% minimum. The simulation did not change our decision. It only made us more sure that the decision was about discipline, and not about a strategy that was secretly broken.
A note on using the new data carefully
We count every out-of-sample run a strategy uses, and we publish the number. This study used 6 in its full testing process. Looking at the test data again and again is how people fool themselves. We open the locked period once for each fixed version, and the count is public.
What we learned
The pattern is real. Every version made money in sample after costs, which matches the research. But the discipline did the useful work. It removed two of three "stable" versions before they could cost us anything. And it stopped us from making excuses for the third one. A near miss goes to the demo account. It does not go in the bin.
The full interactive report is on the results page. It has equity curves, drawdowns and results by year for all three versions.
Questions about the method? We are building our process in public: automatic MT5 testing, choosing stable settings, one-time out-of-sample tests and higher-cost tests. We are happy to talk about it.
Case 004 in one PDF: the exact rules, how we tested them, and what we found. Your email unlocks it and the other 11 case files, plus every new one as it lands.
Run the numbers yourself
The free calculators behind the sizing and robustness checks in this test. No signup.