Quarterly Theory Says the Day's Extreme Forms in Q2. It's the Least Likely Quarter.
Quarterly Theory splits the trading day into four parts of six hours each. It says the second part (Q2) makes the day's high or low. We checked this on three FX majors, three US indices and gold, 2019 to 2021, before we wrote any strategy code. Q2 holds the day's high or low only 16.6% of the time. Chance alone gives 25%, and all seven markets are below chance. Trading the setup loses 0.06R per trade over 2,162 trades. With no costs at all, the price still moves 0.14R against the claim.
Does Quarterly Theory's Q2 'manipulation' quarter set the day's high or low?
No. On seven markets, 2019 to 2021, Q2 held the day's high or low only 16.6% of the time. Chance alone would give 25%. Trading the setup lost 0.06R per trade over 2,162 trades.
What is Quarterly Theory?
Every few years, online retail traders find a new idea about what price is "secretly" doing. Quarterly Theory is the newest one. It comes from a trader called Jevaunie Daye, and it grew out of the ICT trading community. The main idea is that time repeats in the same pattern at every size. Every period of time splits into four quarters, and each quarter always plays the same role.
For one trading day, the story goes like this:
- Q1 (accumulation): price builds a range.
- Q2 (manipulation): price breaks one side of that range to hit stop losses, then comes back. This is called a sweep.
- Q3 (distribution): price runs in the opposite direction.
- Q4: price continues or turns around.
It is popular. There are indicators for it in the LuxAlgo library, several on TradingView, and a strategy page on FX Replay.
We read a dozen of those pages. Not one of them gives a sample size. There is no win rate, no trade count, no test period and no average result per trade. The closest thing to evidence is a soft warning: it works best in trending markets with big-bank activity, and less well in quiet or messy markets.
So we measured it ourselves. We used:
- three FX majors,
- the three US indices that followers of this idea really trade,
- gold.
We used one-minute data from 2019 to 2021. This is our in-sample period (the data we use to build and check ideas). We did not write a trading robot (expert advisor). We also did not touch our out-of-sample data (fresh data we keep for a final test). The idea makes claims we can check directly from raw prices. If the effect is not in the data, there is nothing to automate.
First, we fixed the rules
Ideas like this are hard to test because the rules keep changing. So we wrote our rules down before we ran anything.
The quarters start from a "True Day Open". The sources do not agree if this is 18:00 or 19:00 New York time. We did not want to pick the one that gave a better result. So we measured both. Before the test, we decided that if the two times gave different answers, that difference would be the result.
A sweep means Q2 traded past the Q1 range and then closed back inside it. This is the stricter meaning, and it is the one the sources describe. If Q2 swept both sides, or no side, we skipped that day. The idea gives no rule for those days.
Then we wrote down two claims we could prove true or false:
- The clock claim. The day's high or low forms in Q2 more often than 25% of the time. 25% is what you would get if highs and lows formed at random times.
- The direction claim. After Q2 sweeps one side, Q3 moves the other way far enough to pay the spread and commission.
Claim one: the "manipulation" quarter is the quietest quarter
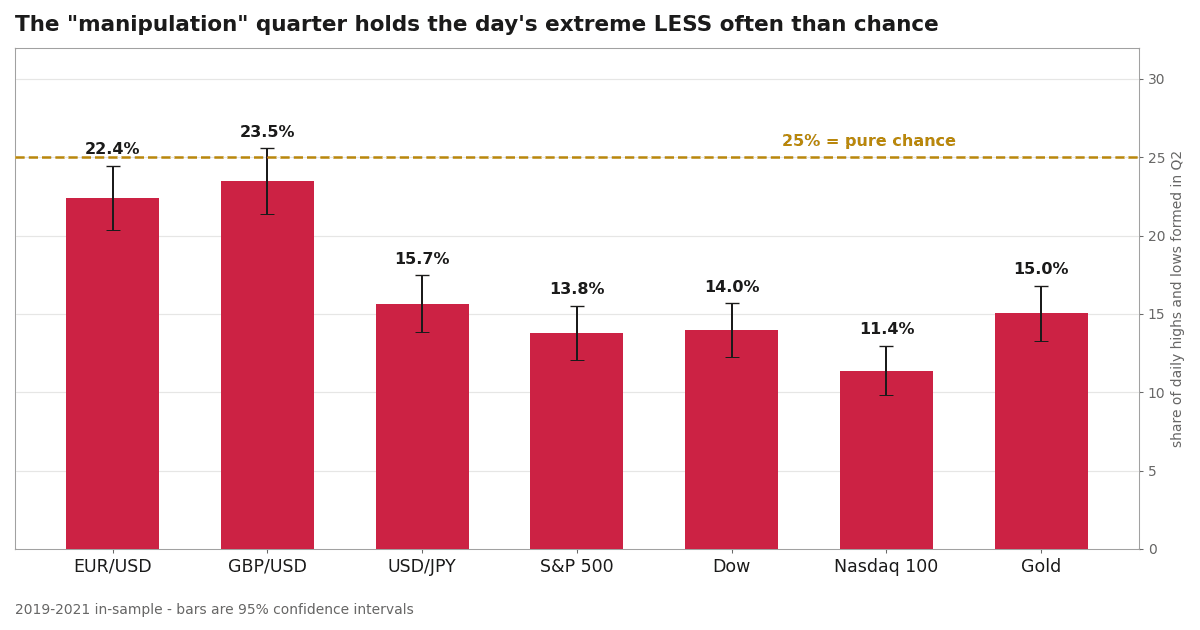
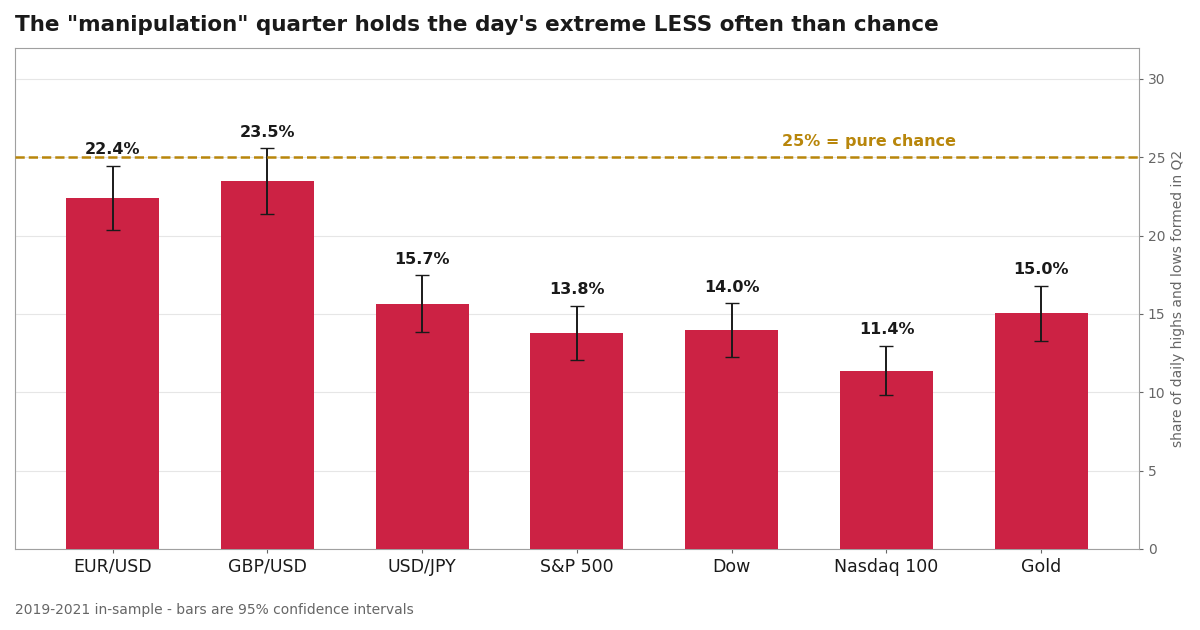 Share of daily highs and lows that form in Q2, by market, with 95% confidence intervals. The dashed line is the 25% you expect from chance.
Over all seven markets, Q2 holds the day's high or low 16.6% of the time. The 95% confidence interval (the range where the true number very likely sits) is 15.9% to 17.3%. Chance gives 25%. The whole range is below chance. So this is not a close miss, and it is not a small sample moving around by luck.
Put simply: the idea says Q2 makes the day's high or low. In fact, Q2 is the quarter least likely to hold it.
Every market is below the 25% line. We measured fourteen results: seven markets, each with both True Day Opens. Only one is above 25%: GBP/USD with the 19:00 start. With the 18:00 start, it falls below again. At 95% confidence, one in fourteen is what pure luck gives you.
Being below chance is not the same as being the quietest quarter. On two markets these are different:
- On five of the seven markets, Q2 is also the lowest of all four quarters.
- On EUR/USD and GBP/USD, Q1 is the quietest, at 19.6% and 20.1%. Q4 is also below Q2 there, so Q2 comes third of four. It is still below chance on both.
On no market does Q2 act like the quarter that makes the day.
So where do the highs and lows really form?
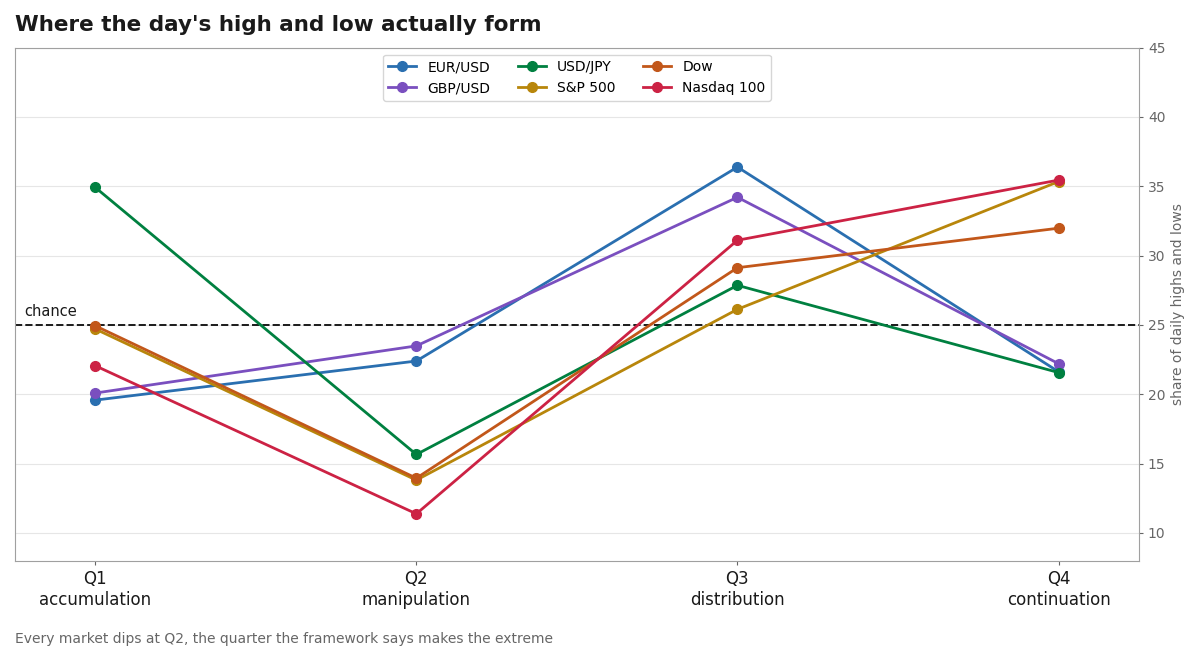 Share of daily highs and lows by quarter. Q2 lands below the 25% null on every market.
- On the currencies and gold, they form most in Q3, between 27.9% and 37.2% of the time.
- On the indices, they form most in Q4, between 32.0% and 35.4%.
In each case, this is the time of day when that market is busiest. Highs and lows form where the trading volume is. This comes from normal market hours, and there is no hidden schedule behind it.
Claim two: no direction that makes money
The second claim is the one you can trade. Every source teaches it the same way:
- Enter at the start of Q3, against the side Q2 swept.
- Put the stop loss just past the sweep.
- Put the take profit at two times the risk (2R).
- Close the trade at the end of Q3 if neither is hit.
We show results in R. 1R is the amount of money you risk on one trade. We use R because dollar results per trade cannot compare an index with EUR/USD. On a market like the Dow, results change so much from trade to trade that a dollar average needs tens of thousands of trades before it means anything.
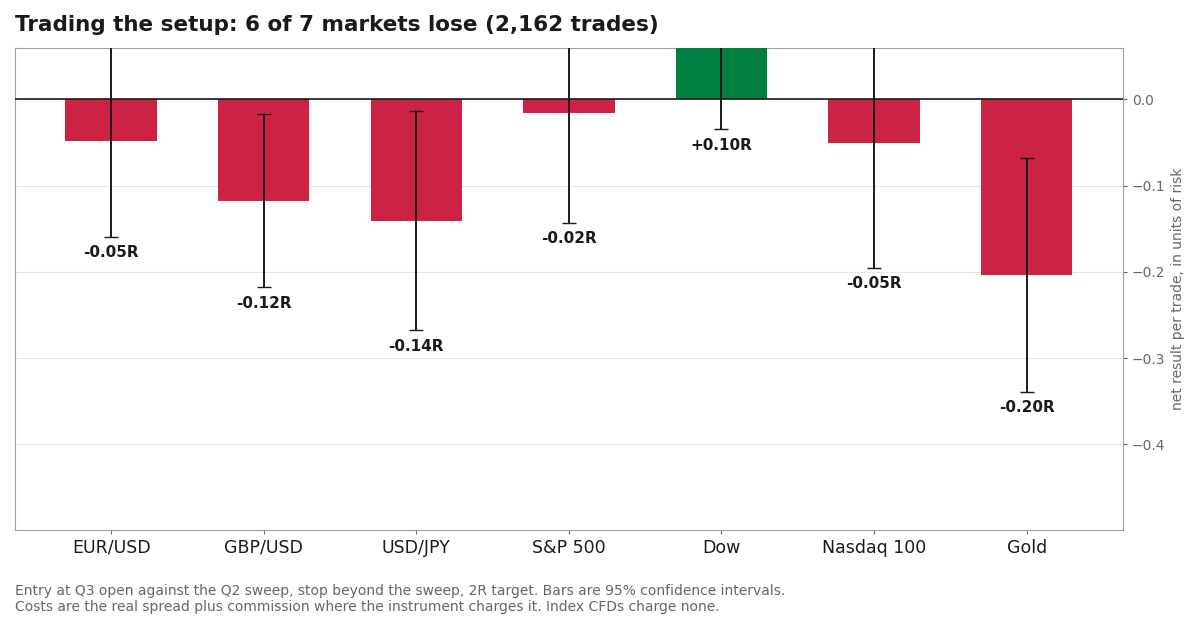 Net result per trade by market, in units of risk, with 95% confidence intervals.
Over 2,162 trades, the setup loses 0.06R per trade. The confidence interval is a loss of 0.11R to 0.02R. The whole range is below zero, and none of the three years made money. The 2R target, the one shown in every example chart in the sources, is hit only 16.1% of the time.
Six of the seven markets lose. The Dow is the exception, at +0.10R. We will not hide it. On one market out of seven, with one of the two start times, this setup made money in our test data. One good result in seven is close to what luck gives. It is not enough to support the whole idea. But it is a real number, and it is on the chart.
People can always blame a loss on the test and not on the idea. So we removed everything that could be our mistake: no stop loss, no take profit, no commission. We only measured how far price moved from the start of Q3 to the end of Q3, in the direction the idea predicts. The result is 0.14R against the claim. The confidence interval is 0.25R to 0.04R against, so it is clearly below zero.
This no-cost number is now the strongest evidence in the study. Even if you do not trust our cost model, the raw price move goes the wrong way.
Case 010 in one PDF: the exact rules, how we tested them, and what we found. Free with your email.
Then we spent a day trying to prove ourselves wrong
A negative result is not worth much if you stop at the first version that agrees with you. So we tried three attacks. We thought any of them might work.
1. Maybe the idea is simply backwards. If trading against the sweep loses, maybe trading with the sweep wins. Then the rules would be upside down, but the clock would still be real. That would be a true finding. This is the one number in the study that looks a little interesting. Trading with the sweep shows 0.14R in its favour, and the interval is above zero. But it does not hold up:
- We ran eight comparisons, so the bar for "real" must be higher. It does not reach that bar.
- The other True Day Open gives a weaker result.
- Traded as a real 2R setup, it loses 0.05R, and the interval includes zero.
2. Maybe we tested the wrong timeframe. The idea says the pattern repeats at every size. A lot of the teaching uses 90-minute quarters, which we had left out on purpose. So we ran the same rules on that smaller scale. This gave about four times more events. On 8,416 setups, the raw price move is 0.0045R, and the confidence interval includes zero. This is the clearest "no effect" result in the whole study. The traded version does worse than the daily version, because you pay the spread four times as often. So the "same pattern at every size" claim fails even more on the smaller scale.
3. Maybe there was a gap in the data. On Mondays, the Q1 range forms during Sunday hours. At that time our data shows prices, but the broker does not accept trades. When we removed every Monday, the total result moved from a 0.06R loss to a 0.04R loss. Nothing important changes.
A correction, 2026-08-19
The first version of this post said the trading loss was 0.23R per trade, not 0.06R. It also said every market lost money. Both came from a wrong cost model.
We charged index CFDs a commission of 7 index points per trade. This came from using our FX cost, $3.50 per side per lot, on markets that do not charge that way. IC Markets charges no commission on index CFDs on either account type. The whole cost is inside the spread. Two other studies on this site already used the correct cost. This one did not.
On the S&P 500 the stop losses are the tightest. There, the wrong commission was 81% of the risk on each trade. When we removed it, the S&P went from a 0.75R loss to a 0.02R loss, and the Dow went from a small loss to a small profit.
We also added gold. It belongs in the list of markets and it was missing.
What this correction does not change:
- Claim one only counts highs and lows. It has no costs in it. So 16.6% against 25% is the same.
- The no-cost price move uses no stop loss, no take profit and no commission. It is the same too.
Both still say the same thing. Only the size of the trading loss changed, and one market went from loss to profit.
How this fits with our other tests
This is now the fifth separate test on this site with the same result for intraday "sweep" and "continuation" setups at normal retail costs:
- The 9:30 opening range breakout does not continue on any of three indices.
- The ICT Silver Bullet loses 0.24R per trade over 2,200 setups on six markets. Its liquidity sweep is the part that makes it "smart money" and not a simple gap fill, and it changes nothing we can measure.
- The London failed breakout fade loses money after a 1.6 pip cost.
- The pivot retest continuation loses money on all thirteen markets we have.
The pattern is the same every time. These ideas describe real things. Ranges do get swept. Stop losses do sit above highs. Price does turn around after it takes them. But the ideas do not tell you which way the next six hours will go. And they do not give you enough edge to pay the spread.
The limits of this test
We used three years of data, and that is all it is. Maybe the idea works in some later market period. We did not test that, but the sources do not claim it either. We tested the daily and 90-minute scales. We did not test the 22.5-minute scale, where the cost per trade would be even worse.
The Dow result is the one that does not fit neatly. It made money in our test data, on one market, with one start time, and its interval still includes zero. We would not trade it. We would not build a strategy on it. But it exists, and you should know about it.
Here is what we can say, clearly and with limits. We tested:
- seven markets,
- three years,
- both published day start times,
- two timeframes,
- both trade directions,
- and a version with all costs removed.
In all of them, Q2 does not make the day's high or low, and Q3 does not move in a predictable direction. The clock does not do what the idea says.
Case 010 in one PDF: the exact rules, how we tested them, and what we found. Your email unlocks it and the other 11 case files, plus every new one as it lands.
Run the numbers yourself
The free calculators behind the sizing and robustness checks in this test. No signup.