The Backtest Claimed +60% in 11 Months. The Real Number Is Closer to 5%.
A gold strategy was published with a great backtest: +60% in 11 months. We tested the same rules on seven years of real data with real costs. The edge is real, but it is about five times smaller than the claim, and half of it came in one year.
Does Larry Williams' volatility breakout on gold really return 60%?
No. On new data from 2022 to 2026, the best version made $3,502. That is about 7.8% a year, with a 23.5% drawdown. The edge is real, but it is about five times smaller than the claim, and most of the profit came in 2025.
The idea
Larry Williams' volatility breakout is a classic strategy. The idea is simple. Look at how far the price moved yesterday (yesterday's range). If today the price moves a good part of that range away from today's open, real buyers or sellers are probably behind it. So you trade in the same direction.
An MQL5 article built this strategy for gold. It showed the kind of backtest that sells trading robots (EAs): +60% in 11 months, "steady progression," and no big drawdowns.
But look at the small print:
- The test covered only January to November 2025. That is one chosen year, on daily bars, during one of gold's biggest price rises.
- It charged zero commission.
So we ran a fairer test. First we tested every setting on three years of tick data (every single price change). Then we gave the best settings one try on four more years the rules had never seen. The answer is neither a clear "it works" nor a clear "it does not work."
How we tested it
We used the same rules:
- Buy when the price closes above
day open + K x yesterday's range. Sell when it closes the same distance below. - Put the stop loss (the price where you exit to limit a loss) at a part of yesterday's range.
- Put the take profit (the price where you exit with a profit) at a multiple of the risk. This multiple is the reward ratio.
- Take only one trade per day. Close it before the next day's levels.
We did not test one lucky year. We tested every combination of:
- breakout multiple: 0.3 to 0.8
- stop multiple: 0.3 to 0.7
- reward ratio: 2 to 5
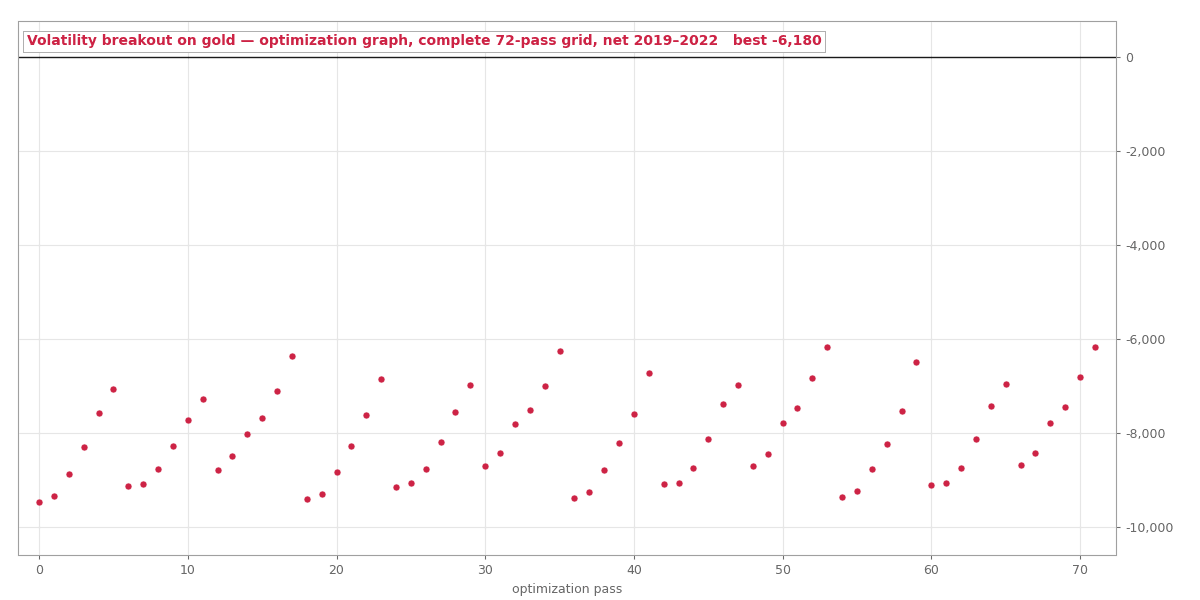
That is 72 settings, tested on 2019 to 2022 with real tick data. Commission and swap (the fee for holding a trade overnight) were included. We did not use a random sample of settings that might miss some areas. We tested all of them.
60 of the 72 made money after commission and swap on this test data (the "in-sample" data, which is the data we use to choose settings). The best settings sit close together, not alone on one lucky spike. That is a good sign. The best area was:
- breakout multiple of 0.5
- a wide stop at 0.7 of yesterday's range
- a reward target of 3 to 5
On real ticks, the best setting made +$11,964 on $10,000 in 479 trades, with a 7.9% drawdown (the biggest drop from a high point).
That is a great result. But in-sample results are easy to get, because you chose the settings by looking at that data. The real test is the next step, and we only get one try at it.
Four years of new data
We picked three settings, wrote them down, and ran each one once on 2022 to 2026. This is "out-of-sample" data: data the rules had never seen. We changed nothing after the test. That data is now used up.
PF in the table means profit factor: total money won divided by total money lost. Above 1 means profit.
| Setting | In-sample 2019-2022 | Out-of-sample 2022-2026 | Drawdown |
|---|---|---|---|
| Breakout 0.5 / stop 0.7 / RR3 | +$11,964 (PF 1.45) | +$1,654 (PF 1.07, 675 trades) | 15.8% |
| Breakout 0.5 / stop 0.7 / RR5 | +$12,423 (PF 1.47) | +$1,781 (PF 1.07, 675 trades) | 15.9% |
| Breakout 0.7 / stop 0.7 / RR3 | +$6,497 (PF 1.39) | +$3,502 (PF 1.20, 502 trades) | 23.5% |
All three made money. All three still made money when we doubled the commission. So the edge is real. If you had traded the best one from 2022 to 2025, you would have made money.
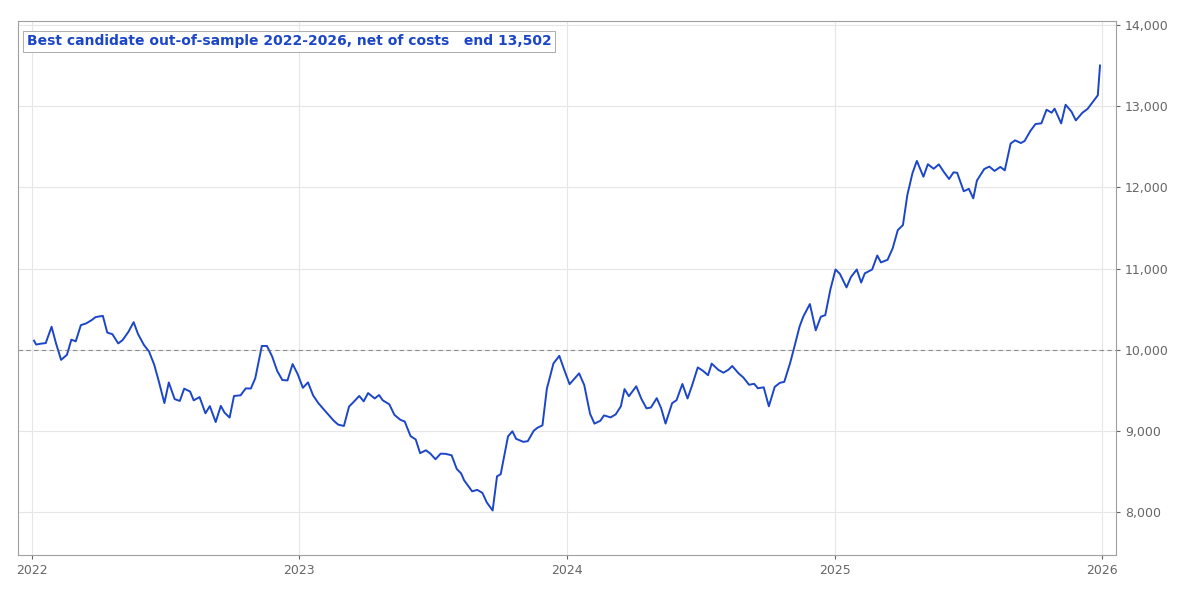 Best setting on new data: two years below the start before 2025 makes the result
But it would have been a hard time. The best setting lost money in its first year (2022: -$299). It made very little in 2023. Most of its four-year profit came in 2025 alone. Year by year: -299, +74, +880, +2,847. The two safer settings lost money in 2023. And a 23.5% drawdown on a strategy that makes less than 8% a year is very painful to live with.
Why it fails our tests
Our rule: a strategy must keep at least half of its in-sample return on new data. These settings keep only 13% to 43%.
- In-sample, the strategy made 18% to 31% a year.
- Out of sample, it made 3.9% to 7.8% a year.
- Drawdowns became two or three times bigger.
So we rejected it. It joins our growing list of strategies that are real but too small to trade.
One detail is important. The profit factor held up much better than the return. It kept 73% to 86% of its in-sample value. So the signal did not stop working. It became smaller and less steady. Why? The in-sample years had COVID and a strong rise in gold. The years after were normal. Many published backtests measure a special period and call it an edge.
Case 001 in one PDF: the exact rules, how we tested them, and what we found. Free with your email.
How much of it was luck?
"All three made money" describes only one series of trades. A fair question is: how easily could it have gone the other way? To check, we resampled each setting's real trade list ten thousand times. This means we built 10,000 new random trade lists from the same trades and looked at the results.
Each run reshuffles the 502 out-of-sample trades, drawing them with replacement, and totals the result. The blue line is what actually happened; the shaded band left of zero is every run that ended in the red.
The three settings give very different answers:
- The aggressive setting holds up. It loses money in only 5.7% of the resamples. Its profit falls between about -$890 and +$7,885.
- The two safer settings do not. They lose money in about one resample in four. Their profit factor at the 2.5th percentile is 0.88. So their +$1,654 and +$1,781 are not strong results. They are the middle of a wide range that easily includes losses.
If you only read the table above, you would not see that two of the three green numbers were close to a coin flip.
The drawdown result goes the other way, and it is good for the strategy. When we shuffle the order of the same trades, the usual worst drawdown is near 12%, and 19% at the 95th percentile. The 23.5% we actually saw is at the 99th percentile. So the real order of trades was an unlucky one.
But be careful with this. Shuffling assumes that one trade tells you nothing about the next one. This strategy made most of its money in a single year. Shuffling breaks up that group of good trades. That is why the shuffled drawdowns look smaller than what you would really have lived through.
Did it beat a simple choice?
This question decides it. We used MAR to compare. MAR is the yearly return divided by the biggest drawdown. Higher is better.
Over the same four years:
- Just holding gold made 24.0% a year with a 20.4% drawdown. MAR: 1.18.
- A very simple trend rule (buy when the price is higher than one year ago) scored 1.24.
- The strategy scored 0.33.
Holding gold made three times the return, with a smaller drawdown. All the extra work gave nothing. For the risk taken, the strategy was about three and a half times worse than doing nothing at all.
This is a harder result than our other tests give, and it is the one to remember. It is true for many strategies, not only this one. A gold strategy tested while gold is rising has to beat holding gold, not zero.
Two data details to know
Sunday bars. If you test daily strategies on UTC data, the market opens on Sunday evening. This creates very small "Sunday" daily bars, with a $3 to $6 range. Real trading days have a range of $11 to $60. Any rule that uses "yesterday's range" must handle Mondays in a special way:
- On Monday, use Friday's full range.
- Never trade the small Sunday bar itself.
If you do not do this, about 20% of trades use wrong levels. Our test handles this, and every number in this post includes the fix.
Weekend and daily breaks in gold. The gold market closes for the weekend and also takes a short daily break. So a strategy that exits after 23 hours cannot always exit in 23 hours. About a fifth of these trades stay open over a weekend. They pay three nights of swap. That cost is included in every number above.
So what was the +60% worth?
It was worth something, and that is the surprise. The rules do have a real gold breakout edge. But the honest version of the claim is: "less than 8% a year with a 23% drawdown, mostly earned in one good year." It is not "+60% in eleven months."
The difference between those two sentences comes from three things: one chosen time period, zero costs, and no test on new data.
What this says about breakout strategies
This is our second test of a breakout strategy. The Asian-session range breakout is a similar idea tied to a trading session. It showed a real edge over many years on USD/JPY, but it failed on EUR/USD. This daily-open breakout is real on gold but too small to pass our tests.
So the label "breakout" tells you very little. What matters is the exact rule on the exact market, and how much of the result is left after costs and new data.
You can see all the strategies we tested, winners and losers, on the results page.
Past performance does not mean future results. These are backtests with real trading costs. They are not live trading results.
Case 001 in one PDF: the exact rules, how we tested them, and what we found. Your email unlocks it and the other 11 case files, plus every new one as it lands.
Run the numbers yourself
The free calculators behind the sizing and robustness checks in this test. No signup.