USD/JPY Bounced the Day After Every Big S&P Selloff. Then the Yen Broke.
A cross-asset rebound found by screening 13 markets: after a large S&P 500 down day, USD/JPY recovered the next day in every in-sample year. Real ticks, real swap, one out-of-sample run: profit factor 1.00.
This one did not come from a forum or a paper. It came out of a screen. We now hold nine years of 1-minute data on thirteen markets, so we asked a plain question of all of them: when one market has a big day, does another market move the next day? Ten pairs of markets, three size thresholds, in-sample years only, and one condition that mattered more than the t-stats: the sign had to hold in 2017 and 2018 as well as in 2019 to 2021.
Most of what lit up failed that condition. Gold predicting the Australian dollar looked wonderful in 2019 to 2021 and was zero before. Gold predicting silver flipped sign. One pair survived. After a large S&P 500 down day, USD/JPY rose the next day, in both halves of the data, and it was not USD/JPY reverting its own move, because USD/JPY's own big days predicted nothing.
The mechanism is old and well described. On an equity selloff the yen gets bought as a safe haven and USD/JPY falls. The people buying yen that afternoon are fast money reacting to a headline. The people selling yen the next day are Japanese, the retail margin traders the Bank of Japan has documented leaning against every yen rally, and the life insurers and pension funds that buy foreign assets on dips. Reflex first, then the larger, slower flow. That is a counterparty we can name, which is our first test of any idea.
The rule, and the measurement that preceded the code
Read the S&P CFD's daily return at 21:00 UTC. If it is below 0.6 standard deviations of its trailing 60 daily returns, buy USD/JPY at 23:00 UTC, after the thin post-close hour when the spread is back to about a pip, and sell at 20:55 UTC the next day. One night held, and long USD/JPY earns swap, so for once the cost line is a credit.
Two independent scripts measured it on 2017 to 2021 before any EA existed: 215 signals, +8.9 pips per trade gross, all five years positive, and a full cost stack of 0.4 pips after the swap. That is twenty times covered. We also measured the mirror trade (short USD/JPY after big S&P up days) and found it did not clear costs, so the spec is long only, and we found that Friday signals traded on Monday morning lost money, so those are skipped.
In sample: every year, and a swap credit on top
Real Dukascopy ticks, $3.50 per side commission, native swaps. The optimizer's two plateaus were both at the 0.6 sigma threshold and differed only in the stop:
| Candidate | In-sample 2017-21 | Out-of-sample 2022-25 |
|---|---|---|
| 40-pip stop | PF 2.09, +$7,200, 150 trades, max DD 4.3% | PF 1.00, −$32, 172 trades, max DD 21.0% |
| 80-pip stop | PF 1.82, +$2,490, 150 trades, max DD 3.4% | PF 0.96, −$283, 172 trades, max DD 12.6% |
The 40-pip candidate returned +3.3%, +17.5%, +8.2%, +23.9% and +5.6% in its five in-sample years. The swap column did what the spec said it would: about 1.6 pips of credit per night, tripled on the Wednesday holds, worth $778 over the window. 2020 was the best year by far, which we flagged before freezing: a rebound that pays most in a panic is a rebound that depends on panics behaving.
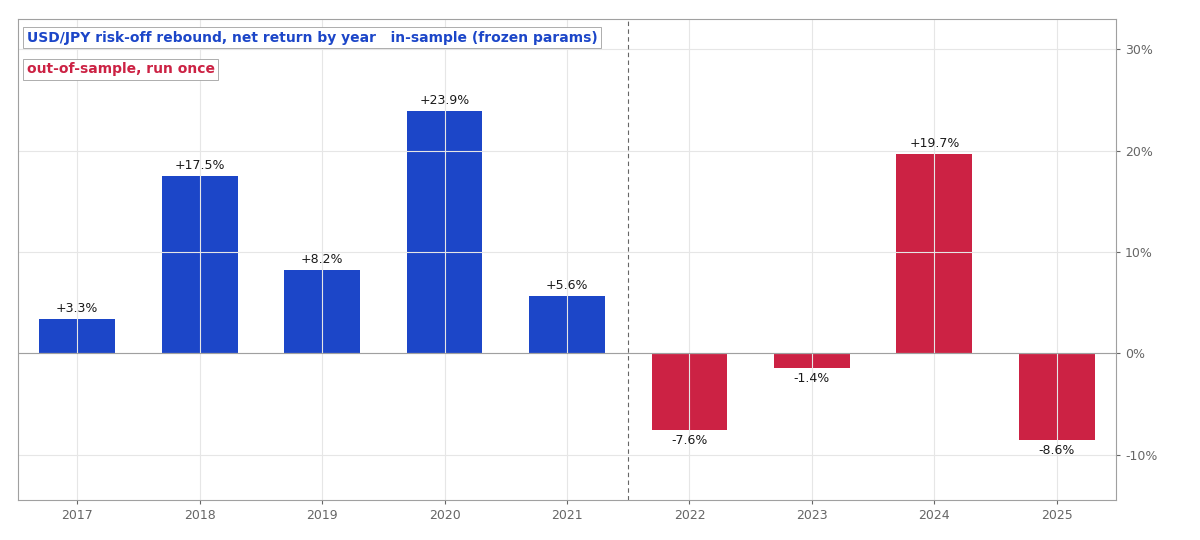 Net return by year. In sample the rebound paid every year; out of sample it paid once, in 2024.
Out of sample: the regime we named as the killer arrived on schedule
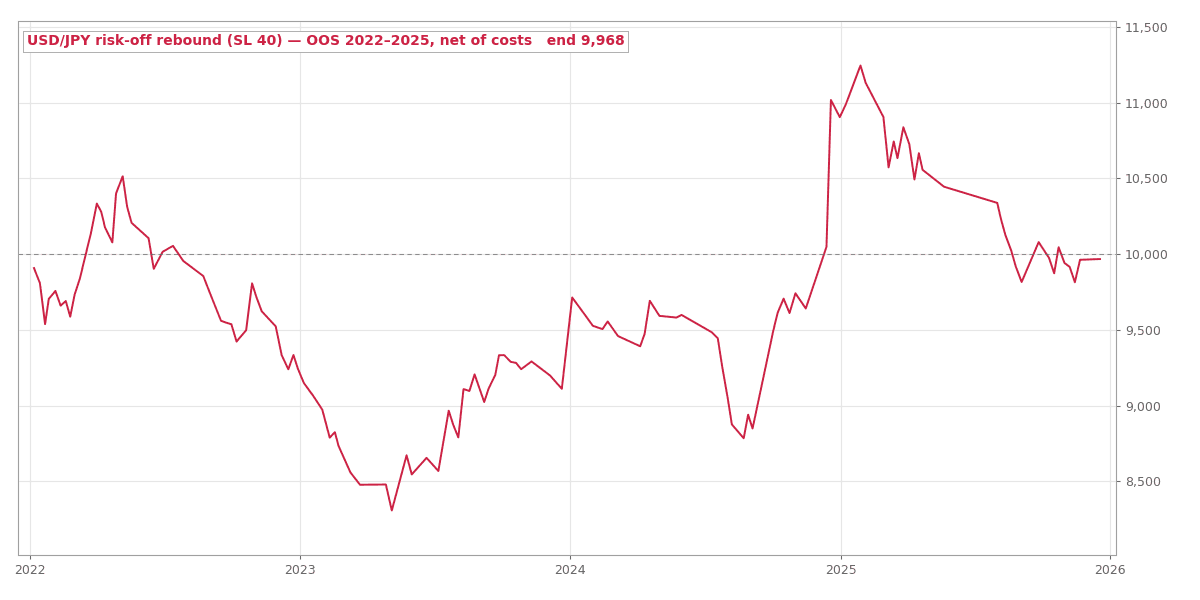
The spec's "how it dies" line said: a sustained regime where the yen keeps moving for days, or the end of the yen as the funding currency. 2022 was both. The Bank of Japan pinned yields while the Fed hiked, USD/JPY went from 115 to 150, the Ministry of Finance intervened, and the pair's daily range roughly doubled. A 40-pip stop that was rarely touched in 2019 got hit on 101 of the 172 out-of-sample trades. Win rate fell from 59% to 37%.
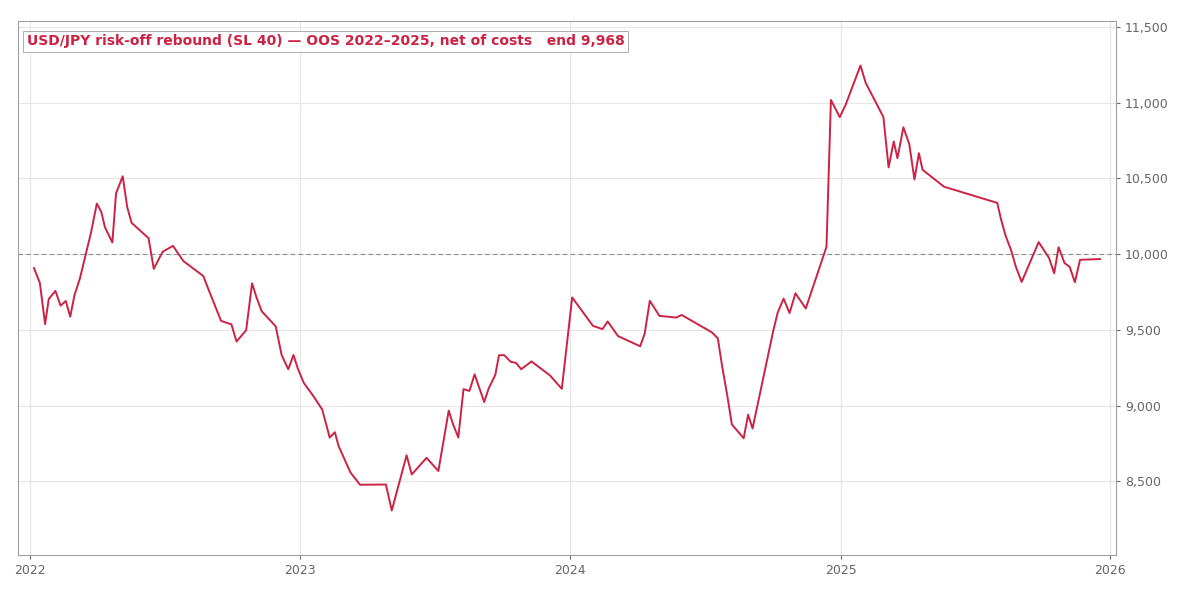 Out-of-sample equity of the 40-pip candidate, net of costs. The 2024 spike is the August carry unwind; the rest is the yen regime eating a fixed stop.
The years tell it: 2022 lost 7.6%, 2023 lost 1.4%, 2024 made 19.7%, 2025 lost 8.6%. The 2024 number is one event, the August carry unwind, when the S&P fell hard and USD/JPY snapped back exactly as the thesis says. Everything around it is a drawdown. The swap credit kept arriving, $583 across the window, and could not matter. Net result over four years: minus $32 on 172 trades, profit factor 1.00, maximum drawdown 21% against a 4.3% in-sample one. Eight gates failed. The wider stop lost slightly more with a smaller drawdown. Rejected.
What we take from it
The screen worked as designed, in a narrow sense. It found a pattern with a named counterparty that held in two separate periods, and the mirror trade and the Friday variant were caught and cut before the tester ran. What it could not do is see a regime change that had not happened yet. Five positive years is a lot of evidence for a pattern and no evidence at all about the conditions that produced it.
The honest conclusion is narrower than "risk-off rebounds do not exist". They existed for five years with a fixed 40-pip stop and a one-day hold. When the pair's volatility doubled, the stop turned a mean-reversion trade into a coin flip with a fee. Whether a volatility-scaled version would have lived is a different strategy, and it would need its own untouched data to be tested on. We do not have any left for this one.
Run the numbers yourself
The free calculators behind the sizing and robustness checks in this test. No signup.