The Pivot Retest Is Negative on All Thirteen Markets We Own
Price breaks a swing high, comes back to test it, a confirmation candle forms, and you enter. Every price action course teaches this. We measured it on thirteen markets and 5,836 setups, 2019 to 2021, before writing any strategy code. It loses on all thirteen, at every profit target from 1R to 3R. And the confirmation candle, the part that is supposed to be the discipline, costs money.
Does the break-and-retest (pivot retest) strategy work?
Not on our data. We checked 5,836 setups on thirteen markets, 2019 to 2021. It lost on all thirteen, about 0.25R per trade, at every profit target from 1R to 3R. Waiting for a confirmation candle made it worse on two of the three main currency pairs.
This is the least exciting strategy we have tested. That is exactly why we tested it.
The idea
The pattern is simple:
- Price breaks above a swing high (or below a swing low).
- Price comes back to touch that level. This is the retest.
- A confirmation candle forms at the level.
- You enter, and price continues in the direction of the break.
Every price action course teaches it. No famous trader owns it, and it has no special name. It feels like patience. That feeling is exactly what makes a rule dangerous: it feels right, so nobody checks it.
What we measured
We used thirteen markets: the main currency pairs (FX majors), the crosses we hold, gold, silver, Bitcoin, and the three US stock indices. We used one-minute data from 2019 to 2021. This is our in-sample period (the data we use to explore an idea before any final test).
The levels are swing pivots. A swing high is a four-hour candle whose high is higher than the two candles on each side of it. A swing low is the opposite. These are not the "pivot points" that floor traders calculate from yesterday's range. That is a different tool with the same name. Swing highs and lows are the levels that break-and-retest teachers actually mean.
The full rules:
- A clear four-hour close beyond the level (the break).
- Then up to 24 four-hour candles for price to come back and test the level.
- An M15 candle (15-minute candle) that dips into the level and closes back through it. This is the confirmation.
- A stop loss (the price where we close a losing trade) beyond the level.
- A take profit (the price where we close a winning trade) at twice the risk. We call this 2R. "R" means the amount you risk on the trade.
- Close the trade after 72 hours at most.
- One trade per level, one open position per market.
The costs are real. We use our data's real spread (the cost to trade) for each minute. When that is missing, we use our normal estimated spread. We add the swap rates (overnight interest fee) we measured for each night, plus $7 per lot round-turn commission on FX.
We did not write an expert advisor (an automated trading program). We never touched the out-of-sample years (the newer data we keep for a final test).
It loses on every market
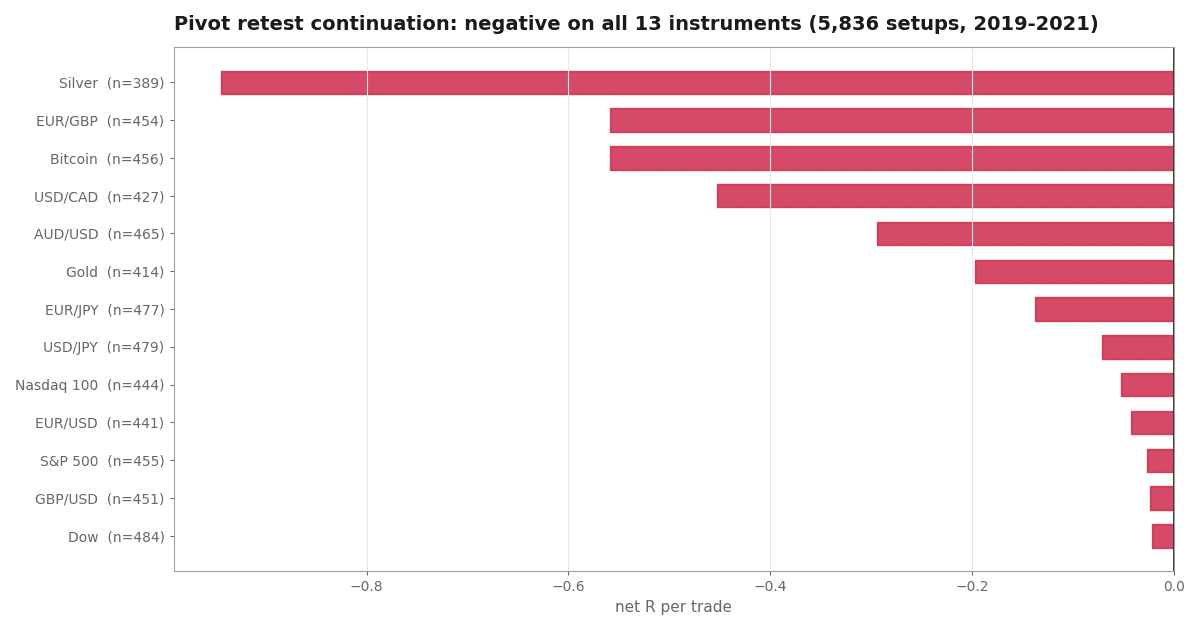
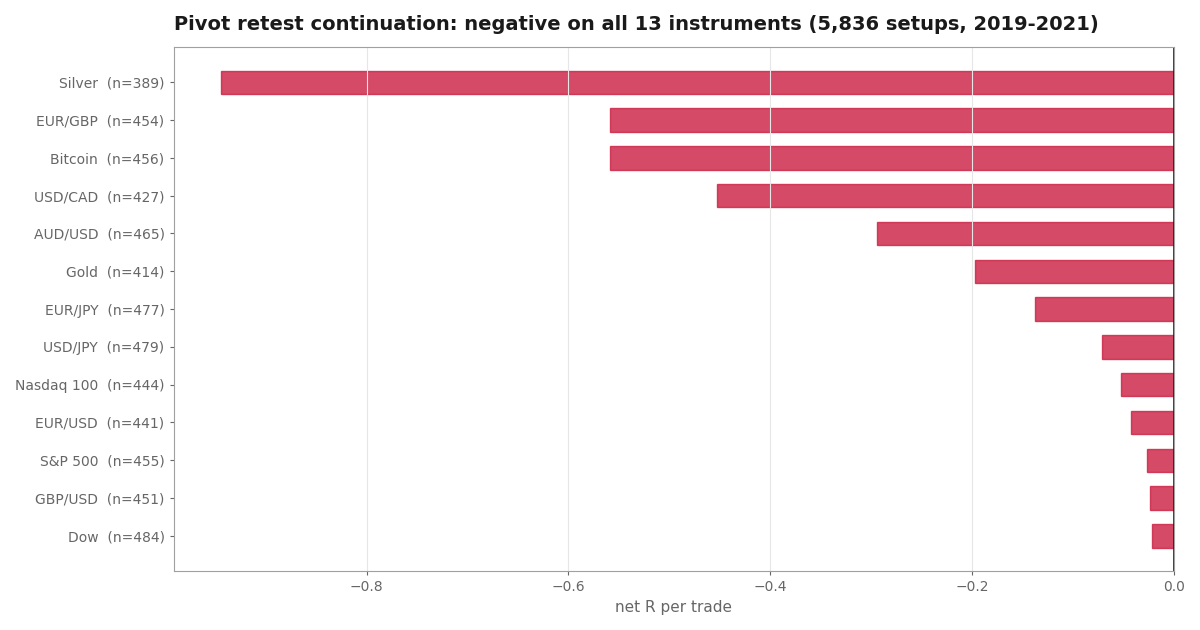 Net R per trade on each of the thirteen instruments, 2019 to 2021.
All thirteen markets lost money. Across 5,836 setups, the combined result was a loss of 0.25R per trade.
This was not eleven out of thirteen. It was not "negative on average, with a few good markets". Every market is below zero. The worst was silver, with a loss of 0.94R. The best was the Dow, with a loss of 0.02R.
That this happens everywhere is the main finding. A strategy that works on some markets and fails on others may have a place where it belongs. This one fails on currencies, metals, stock indices and a cryptocurrency. So it is not about any one market. What it tries to catch is simply not there.
The closest to a winner is the Dow at 0.02R of loss. That loss is so small it is basically just the trading costs. Before costs, several markets make a little money. We have seen this many times: the pattern exists, but it is too small to pay the spread.
Case 012 in one PDF: the exact rules, how we tested them, and what we found. Free with your email.
The confirmation candle costs money
Inside this test is a result we did not expect. It may matter more than the main verdict.
Traders see the confirmation candle as risk control. It stops you from entering too early. It is supposed to be the discipline of a patient trader. Every version of this strategy says you must wait for it.
We ran an A/B test on the three main currency pairs. We decided the test before seeing any results. The two versions:
- A: enter as soon as price touches the level.
- B: wait for a candle to close back through the level first.
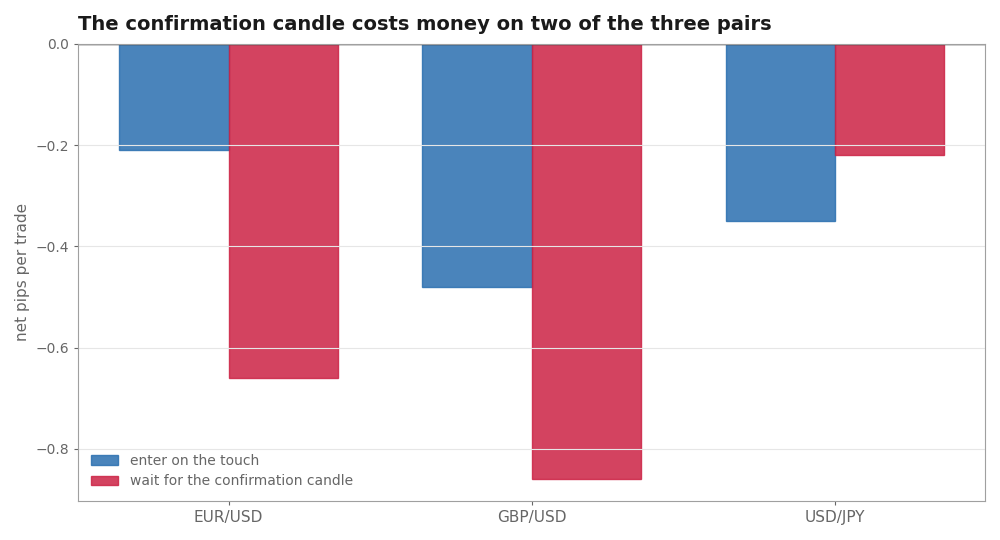 Entering on the touch against waiting for a confirmation candle.
Across the three pairs combined, waiting for confirmation cost 0.23 pips per trade. On EUR/USD it cost 0.45 pips. On GBP/USD it cost 0.38.
There is one exception, and it matters. On USD/JPY the confirmation candle was a little better, by 0.13 pips. So this is true for two pairs out of three. It is not a rule for every market. We also only tested three pairs, not all thirteen.
Still, the direction is clear, and it is uncomfortable. The step that feels careful mostly gives you a worse entry price and nothing in return. We think traders keep teaching it because it feels responsible. We have not seen anyone who recommends waiting for confirmation measure the price they lost by waiting.
No profit target saves it
Someone could object to all of this, and when we read the sources again, we saw they had a point. We tested only one exit: a target at twice the risk. But traders teach several exits:
- A strict 1 to 3 risk-reward (aim to win 3R for every 1R you risk). This comes up often.
- Structure targets, such as the last swing point or the next level.
- Measured moves, which use the height of the range to set the target.
A strategy that loses at 2R does not always lose at 3R. With a win rate (share of winning trades) in the mid-thirties, the size of the wins matters a lot. We had not tested this.
So we moved the target from 1R to 3R and changed nothing else. Same levels, same break, same confirmation, same stop, same costs, same thirteen markets.
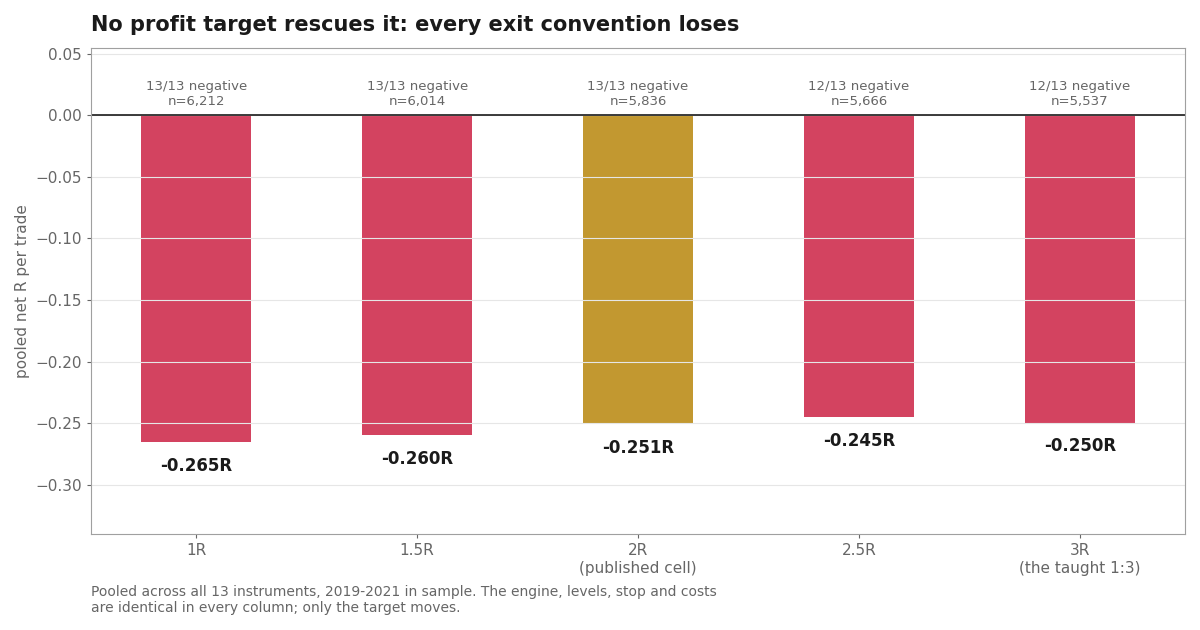 Pooled net R per trade at each profit target, across all 13 instruments.
Nothing changes. From 1R to 3R, the combined result stays between 0.25R and 0.27R of loss. The popular 1 to 3 target gives 0.25R of loss, the same as 2R once you round. At every single target, twelve or thirteen of the thirteen markets lose money.
This flat result tells us more than the first number did. The loss does not come from where we chose to take profit. No exit rule can turn this into a winner, because there is no edge to exit from.
Only one result in the whole table is positive: the S&P 500 at 2.5R and 3R, by 0.026R and 0.010R, on about 440 setups. That is one market out of thirteen, at two targets out of five, and the gain is too small to tell apart from zero. If you test many settings, you will always find one like this by chance. We show it anyway, so we are not hiding anything.
What this test does not cover
- Only three years, in-sample only. We used one definition of a swing pivot and one definition of a confirmation candle. Other ways to define levels exist, and we tested one.
- Sometimes the stop and the target are both hit inside the same one-minute candle, so we cannot know which came first. In that case we count it as a loss (the stop). This is the careful choice. It makes a losing strategy look slightly worse than a perfect test would.
- The confirmation candle A/B test covers three pairs, not thirteen. See it as a strong hint, not a final result.
The verdict
No edge. Thirteen markets, 5,836 setups, all negative, with a combined loss of 0.25R per trade. It loses at every profit target from 1R to 3R, including the 1 to 3 target that teachers recommend. The confirmation candle, which the method treats as discipline, costs money on the pairs where we could test it.
We never opened the out-of-sample data. There was nothing here worth testing on it.
Case 012 in one PDF: the exact rules, how we tested them, and what we found. Your email unlocks it and the other 11 case files, plus every new one as it lands.
Run the numbers yourself
The free calculators behind the sizing and robustness checks in this test. No signup.