The Gap-and-Go Made Money Every Year for Five Years. Then It Stopped.
Buying the S&P 500 after a large gap up was profitable in every in-sample year from 2017 to 2021 and matched a pre-registered measurement trade for trade. Out of sample it made $111 on 169 trades.
Every gap-trading tutorial teaches the same reflex: gaps fill, so fade them. The statistics behind that reflex are real. On the Nasdaq futures, gaps smaller than a third of the daily range fill by the close 78% of the time. What the tutorials skip is the other end of the same table. Gaps bigger than 1.2 times the daily range fill 8% of the time. The fade crowd is right on the small gaps and gets run over on the large ones, and the large ones are where the money is.
That asymmetry is the whole idea. When the S&P 500 CFD opens at least 0.5% above the previous session's close, buy the open, put the stop at that close (a full fill means the thesis was wrong), and sell at 15:55 ET. Long only. The retail fade crowd is the counterparty.
We measured it before we built anything
Our rule is that a strategy has to prove its raw effect exists before an EA gets written. Two independent scripts, five years of 1-minute data from 2017 to 2021, the out-of-sample years untouched. Both scripts agreed to the decimal: 182 gap-up sessions of 0.5% or more, +0.15R per trade with the stop at the prior close, a 95% confidence interval of +0.03R to +0.28R, and every one of the five years positive.
The check we cared about most was the one that killed our opening-range-breakout test in July: is this just being long the market on good days? Gap-up sessions returned +0.172% from open to close against +0.023% for an average session in the same years, seven times the drift, at a t of 1.9. Marginal on significance, but a real gap between the two, not a bull-tape artefact. We wrote down the kill criteria, wrote down the regime risk (a bear market where opening strength gets sold), and built the EA.
In sample, it did exactly what the measurement said
Index CFDs at our modeled broker are spread-only, so the cost stack is the 0.75-point spread on every trade and nothing else. Every figure here subtracts it. The optimizer ran a 36-cell grid over the gap threshold, the exit time and an optional target, and two parameter plateaus came out with all their neighbours profitable:
| Candidate | Rules | In-sample 2017-21 | Out-of-sample 2022-25 |
|---|---|---|---|
| Gap 0.5%, no target | buy open, stop at prior close, sell 15:55 ET | PF 1.49, +$2,807, 181 trades, max DD 7.4% | PF 1.02, +$111, 169 trades, max DD 8.4% |
| Gap 0.4%, 2R target | same, take profit at twice the gap | PF 1.32, +$3,195, 247 trades, max DD 10.5% | PF 1.04, +$397, 217 trades, max DD 7.7% |
The 181 in-sample trades of the first candidate are the 182 events from the measurement, less one. In the smoke test the EA took exactly the twelve sessions the raw data said it should, stops landed on the prior close to the tick, and the yearly returns climbed from +0.9% in 2017 to +8.7% in 2021. Nothing about this was fitted. It was a pattern that existed.
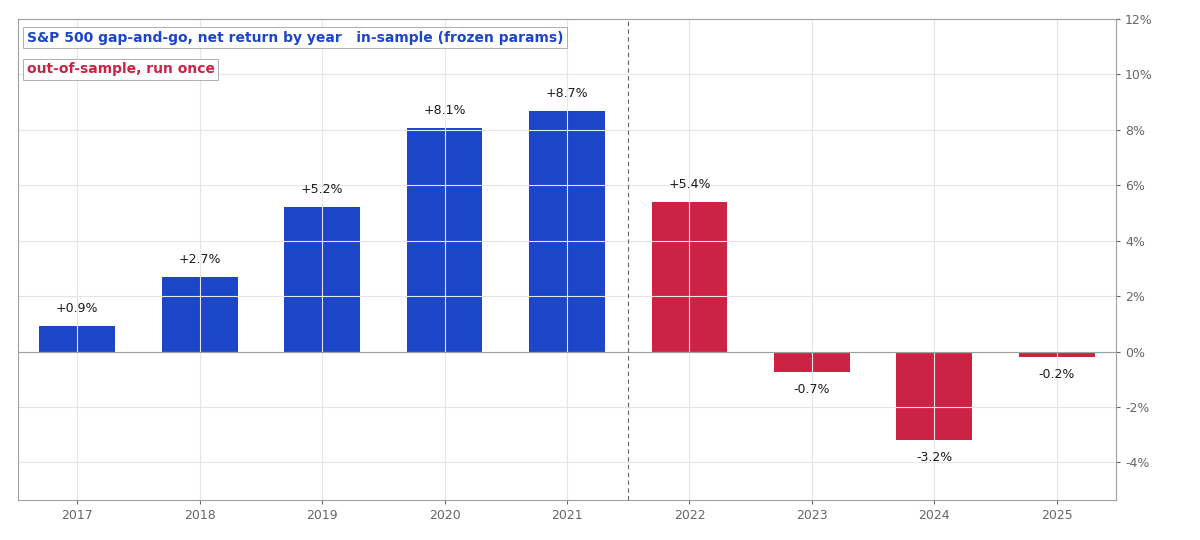 Net return by year. Five green years in sample, then 2022 and nothing.
Out of sample, one good year and three flat ones
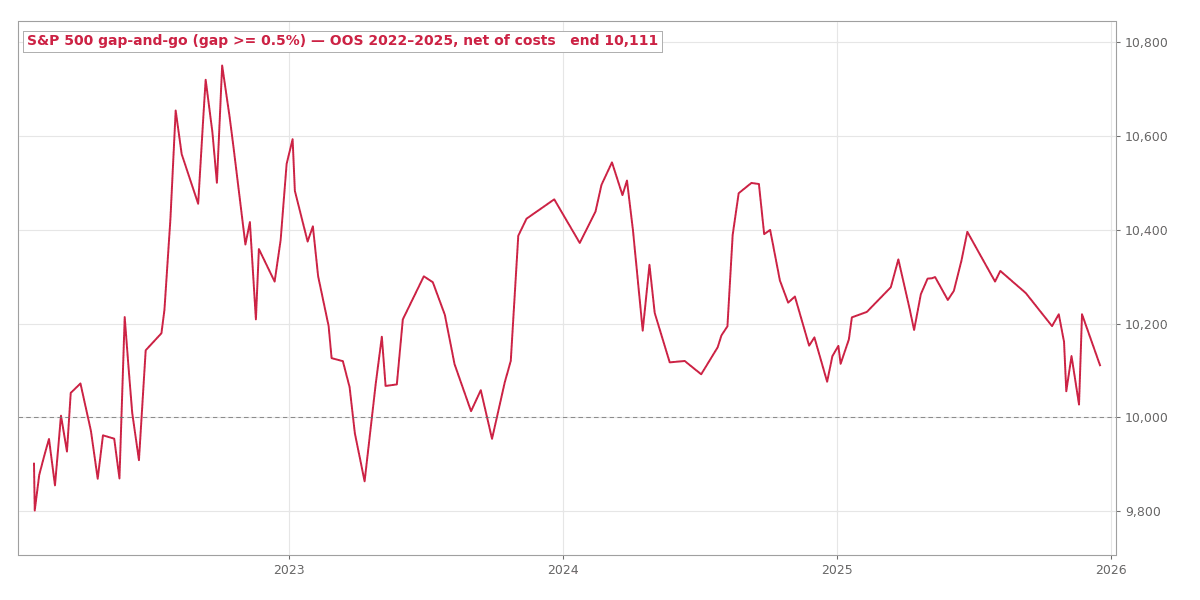
We froze both candidates and gave each one run on 2022 through 2025. The first candidate made 5.4% in 2022. That surprised us, because 2022 was the bear market we had named as the regime that would kill it, and it held. Then 2023 lost 0.7%, 2024 lost 3.2%, 2025 lost 0.2%. Four years, 169 trades, $111 net. Profit factor 1.02 against our 1.15 gate. The second candidate did the same thing with more trades: PF 1.04, $397.
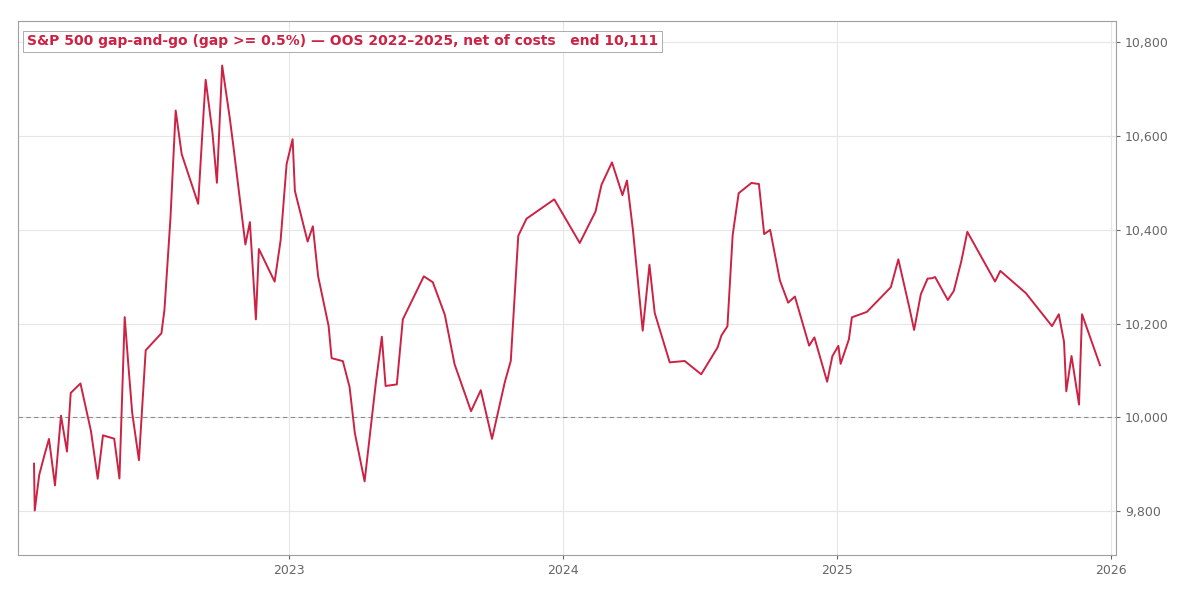 Out-of-sample equity of the 0.5% candidate, net of the modeled spread. A round trip to nowhere.
Stress the costs to $5 per side, the sensitivity we apply to every strategy whether or not the broker charges it, and both candidates lose several thousand dollars. Six gates failed on the first candidate, four on the second. Rejected.
The Dow and the Nasdaq were pre-planned robustness checks with the same frozen parameters, in sample only. The Dow came out strongest (PF 1.52 on 208 trades), the Nasdaq weakest (PF 1.17 on 259), the same ordering the measurement had given. We did not spend an out-of-sample run on either, because the S&P had already answered the question.
What we think happened
The fade crowd did not disappear, but the thing that made fading a large gap expensive did. Through 2020 and 2021 a big gap up in the index was a crowded short at the open and a squeeze by lunch. Since 2023 the large gap-ups have opened and gone sideways. Gross of spread the out-of-sample edge is about 0.7 index points per trade on a 26-point median gap, which is noise with a plus sign in front of it.
This is the second index-open idea to fail here in three months, and the two failures are different. The opening-range breakout never had an effect; it was market beta wearing a breakout costume. The gap-and-go had one, measured it with a confidence interval, reproduced it in a tester, and then watched it end. We would rather publish that than pretend the first five years did not happen.
Two things from the process are worth keeping. The pre-registered measurement is the reason we can say the in-sample result was not fitted: the tester matched a script written before the EA existed. And the one-shot out-of-sample rule is the reason we can say the effect is gone rather than that we found a worse parameter. Both cost us nothing except the temptation to run it again.
Run the numbers yourself
The free calculators behind the sizing and robustness checks in this test. No signup.