The Bitcoin Overnight Drift Is Documented at 33% a Year. At Real Broker Costs It Barely Breaks Even.
A published Bitcoin pattern makes 33% a year on exchange data. We measured it again with a real broker's costs. The 22:00 UTC rule lost money, because there was almost no price move at that hour. When we timed it to the New York close, it made about 0.04% per trade.
Does the Bitcoin overnight drift work?
Not at the published hour. With a real broker's costs, buying at 22:00 UTC and holding for two hours lost 0.095% per trade from 2019 to 2021. There was almost no price move at that hour. When we timed it to the 17:00 New York close instead, it made about 0.04% per trade after costs. That is too small to trade.
Updated October 2026. The first version of this post said the spread was the problem. Since then, we measured what a real broker charges for Bitcoin. It is much less than our price data showed. The result for the 22:00 UTC rule is the same, but the reason is different. We also found a version of the pattern that the first test missed. The numbers below are the new ones.
The idea
Quantpedia describes a Bitcoin time-of-day pattern that sounds very simple:
- Buy at 22:00 UTC.
- Hold for two hours.
- Sell.
On exchange data, this trade made about 33% a year, with a Sharpe ratio of 1.58. The Sharpe ratio measures return compared with risk. Above 1 is good.
The reason sounds possible too. Big exchanges and the futures market take a break around that time. Fewer people are trading. So steady buying can push the price up more easily. And the rules are fully fixed, with no judgment needed.
The first test: every setting lost money
We tested 48 combinations of settings on our 2019 to 2022 in-sample data (the data we use to choose settings):
- start hours from 20:00 to 23:00 UTC
- holding times of one to four hours
- three stop loss sizes (a stop loss closes the trade to limit a loss)
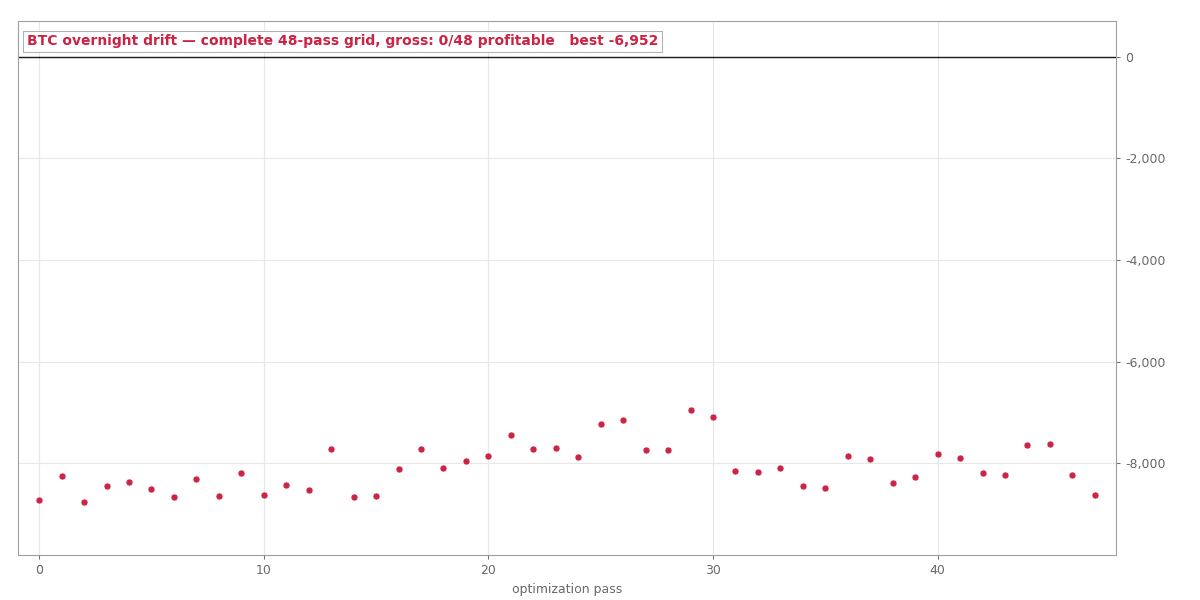
None of the 48 made money.
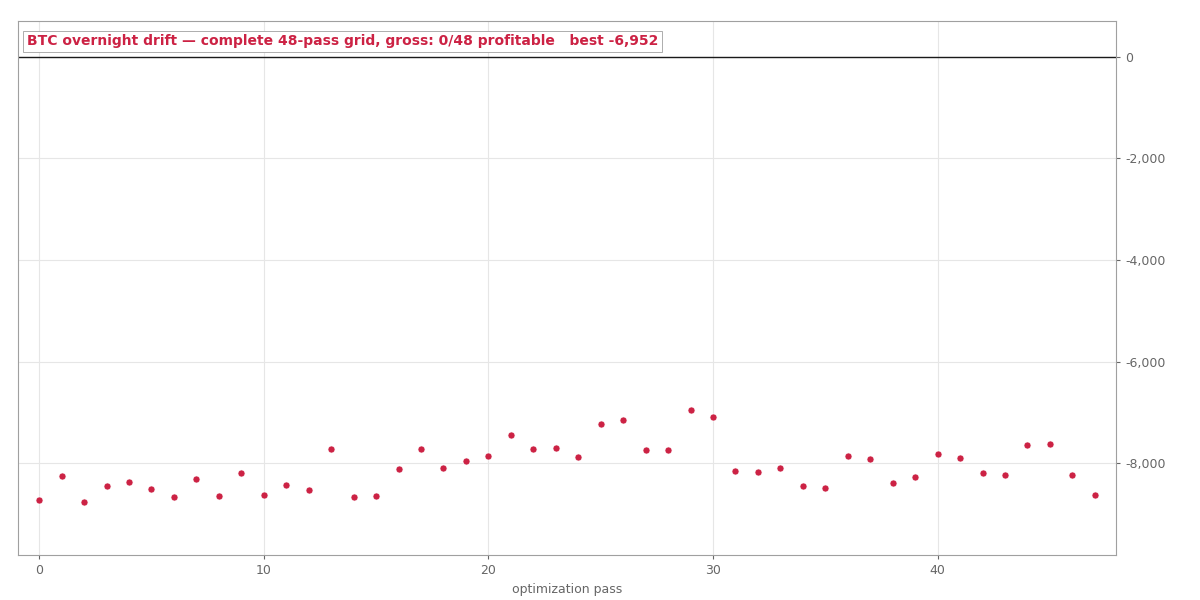 All 48 settings, 2019 to 2022, filled at the data provider's prices. There is nothing to improve here.
Our backtester fills trades using the spread in our price data. The spread is the difference between the buy price and the sell price. Our price data comes from Dukascopy, and for Bitcoin its spread is wide:
- $115 (median) in June 2019
- $112 in June 2020
- $90 in June 2021
That is between 0.25% and 1.35% of the price. The price move we wanted to catch was only a few tenths of a percent. So at first, the spread looked like the whole reason for the losses.
A real broker charges much less
But that is not what you pay at a normal broker. IC Markets shows Bitcoin with a spread of about $5. That is a small part of the data provider's spread.
So we measured the pattern again, straight from the price data. This time we charged IC Markets' real costs: the $5 spread plus $7 commission per Bitcoin. At 2019 to 2021 prices, that is about 0.10% of the price per trade.
With costs this small, the spread cannot be the reason the trade fails. The real reason is simpler:
| buy and hold for two hours, 2019 to 2021 | trades | average move before costs | after IC Markets' costs |
|---|---|---|---|
| from 22:00 UTC, the published rule | 914 | +0.008% | -0.095% |
There was almost no price move at 22:00 UTC in these years. The trade lost money in 2019, 2020 and 2021, even at a real broker. There was nothing to collect.
The move follows New York time
Bitcoin trades all week. But a lot of its trading follows US market hours. And the New York close changes with US daylight saving time (when clocks move one hour forward in summer).
At 17:00 New York time, the end of the US trading day, it is:
- 21:00 UTC in summer
- 22:00 UTC in winter
So a fixed 22:00 UTC rule matches the New York close for only part of the year.
We tied the same two-hour trade to 17:00 New York time instead. Now the move is there:
| buy and hold for two hours, 2019 to 2021 | trades | average move before costs | after IC Markets' costs |
|---|---|---|---|
| from 17:00 New York time | 910 | +0.144% | +0.041% |
57.5% of these trades made money. After costs, the result was:
- negative in 2019. Bitcoin cost only a few thousand dollars then, so a fixed $12 cost was a bigger part of each trade.
- positive in 2020 and 2021.
We checked both tables with a second script. It was written separately, with its own code to read prices and handle daylight saving time. It gave the same numbers.
Why we stopped here
A profit of 0.04% per trade is very small. If the spread were $25 instead of $5, it would become a loss of 0.13% per trade. And $5 is only what IC Markets charges today. We cannot see what it charged in 2019.
We also could not run a full backtest. Our tester uses the data provider's spread. In 2019 and 2020, that spread was wider than this strategy's stop loss. So in those years, many trades would hit the stop loss in the first minutes. That would not happen in a real account. We decided the edge was too small to be worth building better data for it.
What we learned
We learned two lessons. The first version of this post had only half of the first one.
- Test with the costs your broker really charges, not the costs in your price data. The two can be very different. Bitcoin is the most extreme case.
- For Bitcoin, use New York time. A pattern tied to a fixed UTC hour can be split across two different market moments for half the year.
The exact rules of every strategy we've put on trial, how we tested each one, and what the data showed. 12 case files so far, free with your email.
Run the numbers yourself
The free calculators behind the sizing and robustness checks in this test. No signup.