Edge or Luck? We Ran Our Own Forward Test Through a Free MT5 Check
Resampling your closed trades tells you whether the average trade could still be luck. We pointed our free YuRaLytics panel at our three demo forward-test accounts.
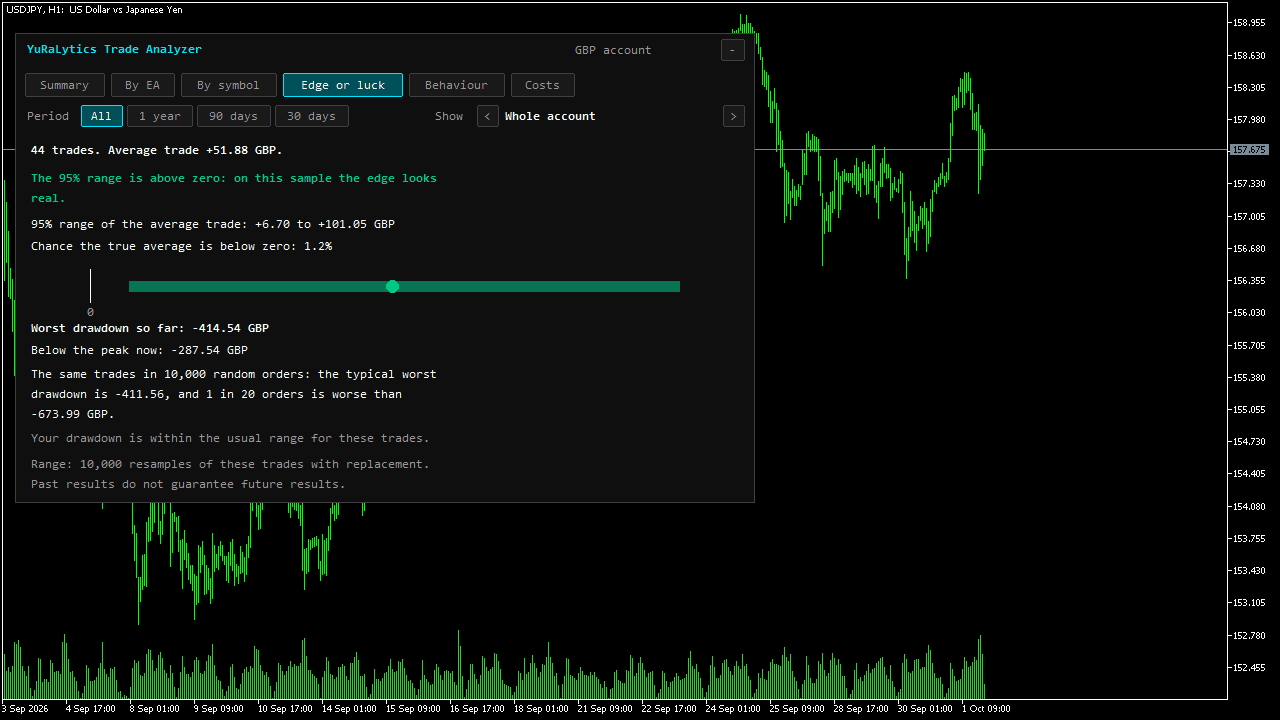
Forty-four trades in, the range breakout forward test is up 2,282.90 GBP on an 11,000 GBP demo account, with a profit factor of 2.47 and a 50% win rate. Numbers like that are the ones we trust least, because two good months can come from almost anything.
Every EA owner ends up asking the same question: is this an edge, or a lucky run? The net profit can't settle it, and the profit factor can't either. They tell you what happened, and say nothing about how easily it could have happened by chance.
We built a free MetaTrader 5 panel to answer that, YuRaLytics Trade Analyzer. The fairest way to show what it does is to point it at our own forward test, including the parts that don't flatter us.
The test, in plain terms
Take your closed trades. Draw 44 of them at random, with replacement, so some trades show up twice and some not at all. Work out the average. Do that 10,000 times.
You now have 10,000 versions of your history that could just as easily have happened. The middle 95% of their averages is the range your true average trade most likely sits in. Statisticians call this a bootstrap.
If the whole range is above zero, the edge looks real on this sample. If the range includes zero, you can't rule out luck yet.
The bootstrap makes no assumption about the shape of your returns. That matters in trading, where a handful of big winners usually carries the whole result and a bell curve is the wrong model.
Our three forward-test accounts
Each strategy runs on its own IC Markets demo account, and every trade is public on the forward test page. This is what the panel said when we read it on 1 October 2026:
| account | closed trades | average trade | 95% range of the average | chance the true average is below zero |
|---|---|---|---|---|
| Range breakout, USD/JPY | 44 | +51.88 GBP | +6.70 to +101.05 GBP | 1.2% |
| Gotobi, EUR/JPY | 12 | +23.58 GBP | +2.42 to +43.63 GBP | 1.6% |
| Gotobi Tokyo fix, USD/JPY | 12 | +13.60 GBP | -4.11 to +30.66 GBP | 6.6% |
Each account gets a different answer, and the differences are the useful part.
Range breakout: the range clears zero, but look how wide it is
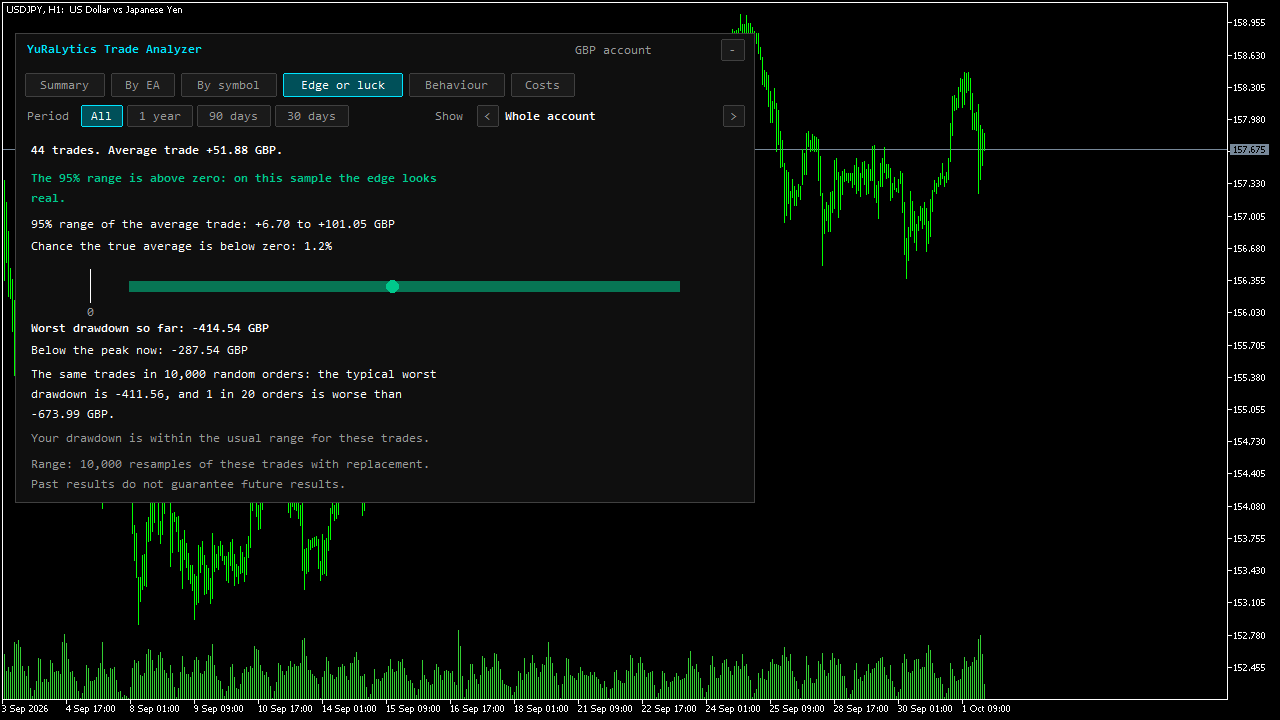 The Edge or luck tab on the range breakout demo account: 44 trades, average +51.88 GBP, 95% range +6.70 to +101.05 GBP, 1.2% chance the true average is below zero.
The whole range sits above zero, so on these 44 trades the panel says the edge looks real. Look at the range itself, though: +6.70 to +101.05 per trade. The low end is about an eighth of the average we have seen so far, and the data are perfectly happy with an edge that small.
That matters here because this forward test is running hot. The same rules over 1,012 out-of-sample backtest trades, 2022 to 2025, had a profit factor of 1.16. Forward, it is 2.47. The bootstrap says the average is probably above zero. It has no way of knowing whether two months of trading look like the next two years. We expect the profit factor to drift back toward the backtest, and we will publish it when it does.
Gotobi EUR/JPY: above zero, and still not a verdict
Twelve trades, a range entirely above zero, a 1.6% chance of a negative average. On the numbers alone you might call it. The panel won't: below 30 trades (the default, which you can change) it says the sample is too small to judge.
With a dozen trades the bootstrap can only reshuffle those dozen, so it never sees the losses that haven't happened yet. Ten of the twelve were winners. That win rate won't hold, and until the losers turn up the range comes out too narrow and too sure of itself. Thirty trades is the least we would accept, and plenty of strategies need far more before the range means much.
Gotobi Tokyo fix: could still be luck
The range runs from -4.11 to +30.66, so zero is inside it, and there is a 6.6% chance the true average is below zero. Twelve trades puts it under the minimum anyway, but even without that rule the answer would be "can't tell yet". For a strategy that trades about six times a month and has run for two months, that is the right answer.
The exact rules of every strategy we've put on trial, how we tested each one, and what the data showed. 12 case files so far, free with your email.
Is the drawdown normal?
The other question comes up when an EA is underwater: is it broken, or is this just what it does? The panel answers it with a different shuffle. It puts the same 44 trades in 10,000 random orders and records the worst drawdown of each.
For the range breakout, the worst drawdown so far is 414.54 GBP. Across the shuffles the typical worst drawdown is 411.56 GBP, and 1 order in 20 is worse than 673.99 GBP. Ours is ordinary. The account is 287.54 GBP below its peak right now, which is also well inside the usual range.
If an account falls past that 1-in-20 line, either its trades have arrived in an unusually bad order or the strategy has changed. The panel can alert you when that happens, with a pop-up or a push notification to the MetaTrader app. It is off by default.
One caveat. The shuffle only uses trades you already have, and a strategy that is breaking down tends to produce new kinds of losses. When the alert fires, go and look at what the EA has been doing; the alert alone doesn't prove anything is broken.
Losing streaks
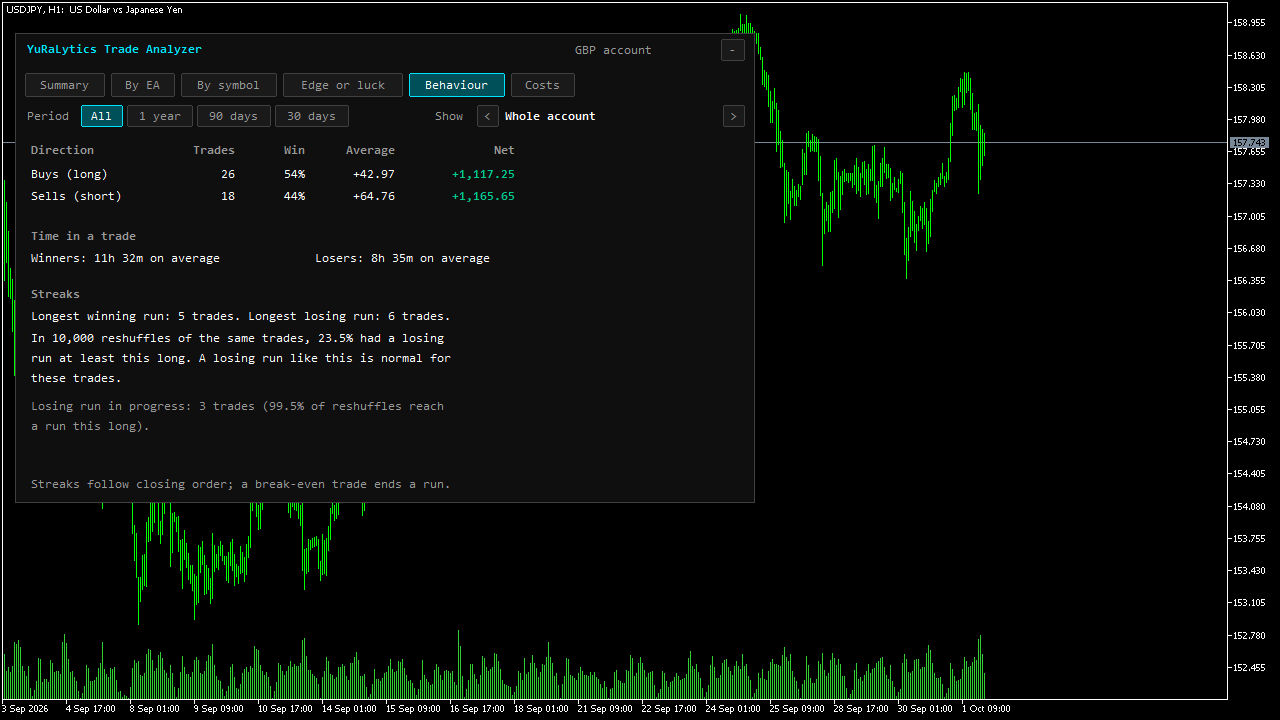 The Behaviour tab: buys against sells, average time in winning and losing trades, and the longest losing run of 6 trades, which 23.5% of reshuffles match or beat.
The longest losing run on this account is six trades. In 23.5% of reshuffles of the same trades, a run at least that long turns up. Six losses in a row feels bad while you watch it happen, but for these trades it is normal.
A second optional alert covers this. It fires when the losing run in progress gets so long that fewer than 1 in 20 reshuffles contain a run that long.
Costs
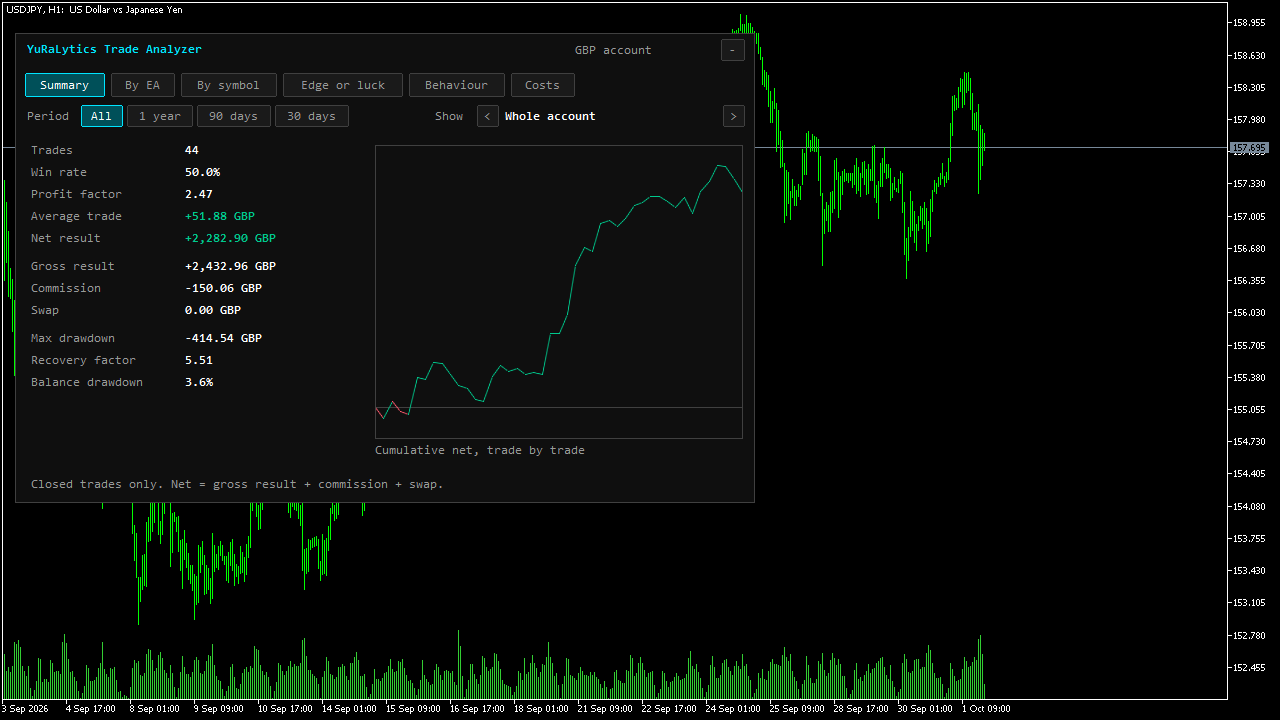 The Summary tab: 44 trades, net +2,282.90 GBP, gross +2,432.96 GBP, commission -150.06 GBP, swap zero, maximum drawdown -414.54 GBP.
Commission took 150.06 GBP of the 2,432.96 GBP gross result on this account, or 6.2%. Swap was zero because the strategy closes the same day. The panel reads these straight from the broker's deal records, so they match what you were charged.
6.2% is low because the average trade is large right now. In the backtest of the same strategy, where the average trade was smaller, commission took about a quarter of the gross profit. It is worth checking that share on every EA you run.
What the panel can't tell you
Every number above describes trades that already happened. The panel cannot tell you whether the future will look like the past, or whether two months of one market is a fair sample of the next year. It counts a trade once the position is closed, so open positions are not in any of these figures.
Try it on your own account
YuRaLytics Trade Analyzer is free on the MQL5 Market. Attach it to any chart. It only reads your history and never opens, changes or closes a trade, so it can run next to live EAs. It splits everything by magic number and by symbol, which means an account with several EAs gets one answer per EA instead of a blend.
We will keep running our own forward test through it and publishing what it says, including when the answer gets worse.
The exact rules of every strategy we've put on trial, how we tested each one, and what the data showed. 12 case files so far, free with your email.
Run the numbers yourself
The free calculators behind the sizing and robustness checks in this test. No signup.