Every Configuration Lost Money: RSI(2) Mean Reversion Meets Gold
We took a well-known strategy that works on daily stock charts and tested it on the 1-hour gold chart. We used three years of tick data with real costs. Every setting lost money, and the reason is simple: the wins are too small to pay the costs.
Does the RSI(2) pullback strategy work on gold?
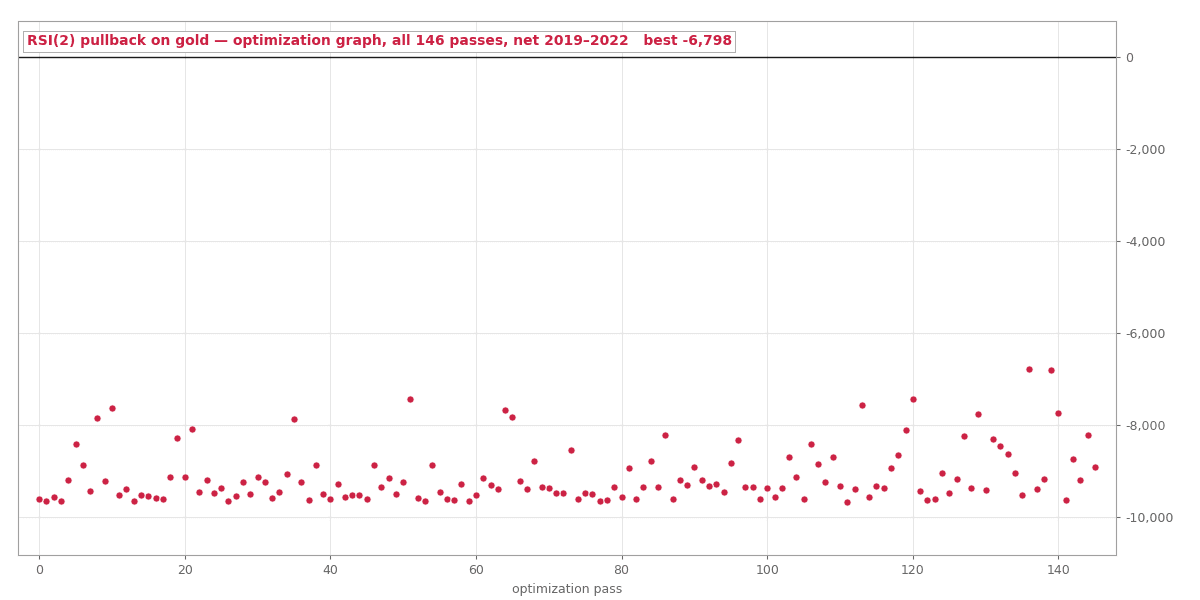
Not on the 1-hour gold chart. We tested all settings on 2019 to 2022 tick data with real costs, and every one lost money. The best lost $862 (profit factor 0.90). The winning trades were only about as big as the trading cost.
What is the RSI(2) pullback?
Larry Connors made this strategy famous. Many traders have tested it and found that it works. It is a mean reversion strategy. This means it bets that after a sharp drop, the price will come back up.
The rules are simple:
- The RSI is an indicator that shows if the price fell or rose too fast. Here we use a very short RSI, with only 2 periods.
- When the 2-period RSI is very low (the price is "oversold"), and the price is still above its 200-period average, you buy the dip.
- You sell when the RSI goes back up.
It has many years of good results on daily charts of US stocks. An MQL5 article recently built three versions of it for MetaTrader.
We wanted to know if it also works on gold on the 1-hour (H1) chart. Gold often moves too far during the day and then comes back. That sounds perfect for mean reversion. But our own notes were honest: this was an idea moved from another market, so we wrote "treat a rejection as informative, not surprising." Still, we did not expect the result we got.
Not one setting made money
We tested many combinations of four settings:
- the RSI level to enter,
- the RSI level to exit,
- the length of the trend filter (the moving average),
- the size of the stop loss, as a multiple of ATR (Average True Range, a measure of how much the price usually moves).
We used real tick data from 2019 to 2022, with commission and spread included. This is called optimization: the computer tries all settings to find the best one.
Every single setting lost money.
- The best one lost $862 on a $10,000 account. Its profit factor was 0.90.
- The worst one lost $8,498, with a profit factor of 0.66.
The profit factor is total wins divided by total losses. A profit factor of 0.90 means the strategy won 90 cents for every dollar it lost. So the strategy is not totally broken. It just loses a little, again and again, because of the costs.
Why it failed: the wins are smaller than the costs
The reason is simple. The signal is not wrong. The problem is size:
- A 2-period RSI moves back up within one or two H1 bars. So each winning trade only catches a small, fixed piece of the gold move.
- That piece is about the same size as the cost of one trade (opening and closing). In our tick data, the spread on gold was $0.46 to $0.88 for most of the period. On top of that, commission was $7 per lot.
- Losing trades run all the way to the stop loss, which is based on ATR. This stop is several times bigger than a normal winning trade.
Small wins and big losses can still work. But only if you win very often. Here, you never win often enough. Each setting made 300 to 1,900 trades, and on average each trade lost a couple of dollars. No change to the RSI levels, the filter or the stop size fixes this math.
The famous RSI(2) edge works on daily bars. There, the average move is much bigger than the cost. On gold H1, the moves are smaller, and the costs eat all the profit.
Why this rejection cost us almost nothing
We split our data into two parts:
- In-sample data (2019 to 2022): used to test and pick settings.
- Out-of-sample data (2022 to 2026): kept aside. We use it only once, as a final check, and only for settings we have already fixed.
This strategy never reached the second step. Nothing made money in-sample, so there was nothing to pick, and we used zero out-of-sample runs. The whole test took one optimization run, about ten minutes.
Many traders do it the other way. They trade a strategy that sounds good with real money, and only stop when the spread losses are too big to ignore.
What we changed in our process
Every rejection should make our process better. This one did.
Our checklist before any test now has a new step. We estimate how big a normal winning trade is, in price. Then we compare it to the real spread of that market. If the normal win is smaller than about 3 times the spread, the backtest can only show that the spread wins. So we do not run it.
More from our research: the Tokyo-fix study (a real edge that we rejected anyway) and the range breakout that started this project (one strategy, two pairs, opposite results). You can see all the strategies we tested, winners and losers, on the results page.
Past performance does not mean future results. These are backtests with real trading costs. They are not live trading results.
Case 002 in one PDF: the exact rules, how we tested them, and what we found. Your email unlocks it and the other 11 case files, plus every new one as it lands.
Run the numbers yourself
The free calculators behind the sizing and robustness checks in this test. No signup.