The Tokyo Fix Anomaly: a Real Edge That Still Didn't Make the Cut
We tested the famous 'gotobi' USDJPY anomaly on 7 years of tick data. It's real — and we still rejected it. Here's the whole story, including the bug we found along the way.
Every so often a trading anomaly comes with an actual paper trail. The gotobi effect is one of them: on Japanese calendar days divisible by 5 — the 5th, 10th, 15th, 20th, 25th and 30th — importers settle dollar-denominated invoices, and their banks buy USD ahead of the Tokyo fix at 9:55 JST. The result is systematic USDJPY buying pressure into the fix on those days, documented by Ito & Yamada in NBER WP 22820 and revisited in arXiv:2301.13204. The flow is commercial, not speculative — the classic argument for why an anomaly can stay alive after everyone knows about it.
That made it the perfect first test for our research pipeline: mechanical rules, an academic anchor, and a clock with no DST ambiguity (JST never shifts, so the fix is always 00:55 UTC).
The rules we tested
- Trade only gotobi days; weekend dates shift to the preceding Friday, per Japanese settlement convention
- Buy USDJPY N hours before the fix — N is the parameter we optimized
- One trade per fix, long only
- Hard exit at the fix, win or lose — the documented pressure ends there
- Fixed stop loss (15–60 pips explored), 1% of equity risked per trade
How we tested it
Dukascopy tick data, real-tick modeling, $10,000 start, commission included at $3.50/side/lot. In-sample optimization ran on 2019–2022 only; we selected parameter plateaus (a candidate only counts if its neighbors are profitable too, not just the single best pass); and the 2022–2026 window stayed locked until candidates were frozen — then each got exactly one out-of-sample run.
Three candidates survived in-sample selection, all with net profit factors above 2.0. Then the out-of-sample window delivered its verdict:
| Candidate | In-sample 2019–22 | Out-of-sample 2022–26 | Outcome |
|---|---|---|---|
| Enter 4h before fix | PF 2.10, +$1,295 | PF 0.79, −$1,130 | Collapsed |
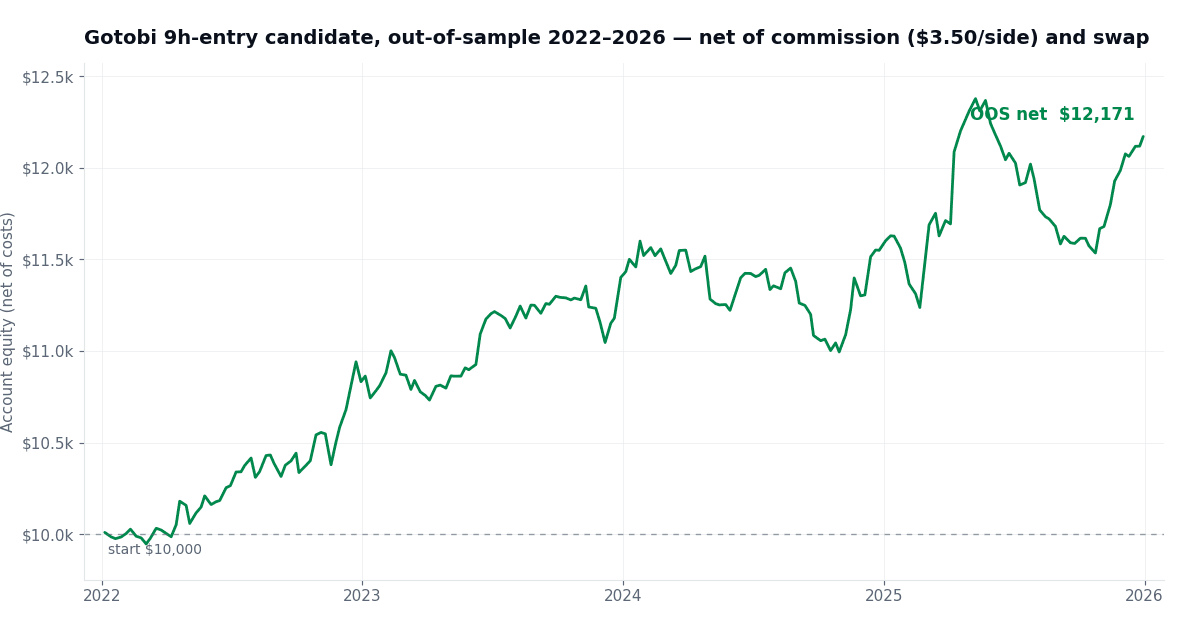
| Enter 9h before fix | PF 2.04, +$1,668 | PF 1.36, +$2,171 | Real edge |
| Enter 8h, tight stop | PF 2.10, +$4,125 | PF 1.03, breakeven | No edge after costs |
Two candidates died. That's the headline.
All three sat on genuine in-sample plateaus with profitable neighborhoods. Robustness checks passed. And still, the 4-hour entry — the best-looking region by fitness — lost money on four years of unseen data:
 The 4h-entry candidate out-of-sample: what optimization residue looks like
In-sample robustness is necessary, but it is nowhere near sufficient. If we had published the 4h-entry backtest in March 2022, it would have looked spectacular — and then quietly bled for four years.
One candidate held — and we rejected it anyway
The 9-hours-before-fix entry kept a real edge out-of-sample: profit factor 1.36 across 283 trades, +21.7% over four years at 1% risk per trade, maximum drawdown just 6.8%, still profitable with commission stressed to $8.50/side. Part of the return is even structural — long USDJPY carries positive overnight swap, which subsidizes the pre-fix hold.
 The 9h-entry candidate out-of-sample: a real, if modest, edge
So why reject it? Our gates require a candidate to keep at least 70% of its in-sample profit factor out-of-sample. This one kept 67%. Close — but lowering a bar after seeing the result is just data snooping with extra steps. The asymmetry is the whole point: skipping a marginal edge costs nothing, while going live on optimization residue costs real money.
Instead, the surviving configuration moved to a demo forward test — the one dataset nobody can overfit. If live-forward months keep tracking the out-of-sample profile, it earns another look.
The bug we found (and why we're telling you)
Midway through this study, a code review caught a position-sizing bug: the tester's tick-value data for our custom symbols was stale, so trades were risking roughly 1.5–2× the intended 1%. We fixed the sizing to use the tester's own profit calculator and re-ran the entire cycle from scratch — same conclusion, honest numbers. Every out-of-sample run is counted and disclosed (this strategy consumed 6, including the re-run). Transparency about process is the only thing that makes backtest numbers worth reading.
What we took away
- The anomaly is real. Every configuration was profitable in-sample, net of costs, consistent with the literature.
- Out-of-sample discipline is the product. It killed two of three "robust" candidates before they could cost anything.
- A near-miss isn't a fail-and-forget. The 9h entry is on a live demo forward test — evidence that no backtest can fake, at a price of zero.
The full interactive report — equity curves, drawdowns, yearly breakdowns for all three candidates — is on the results page.
Questions about the method? The pipeline (headless MT5 testing, plateau selection, one-shot out-of-sample, cost stress) is being built in public — we're happy to talk shop.