We Gave a Trend System Five Years of Sample. It Gave Back a 1.17 Profit Factor.
This is the first test with our new 5-year test period for slow trend strategies. EURJPY channel breakouts have a small real edge, but never enough to pass. The filter that helped Bitcoin made EURJPY worse.
Does a Donchian channel breakout work on EUR/JPY?
Only a little. Over five years of test data, the best setting reached a profit factor of 1.17. Our minimum is 1.3. The midline filter that helped Bitcoin made EUR/JPY worse (1.17 down to 1.10).
Why we used five years of data
After our gold chandelier test, we changed how we test, but we did not lower our standards.
Some strategies only trade 30 to 50 times a year. In three years, that is not enough trades to trust the result. So these strategies can now use a five-year in-sample period (2017 to 2022) instead of three years. In-sample means the data we use to build and check an idea. We set this period before the test, and every quality check stays the same.
This is the first strategy to use the longer period, and it did its job. Each of the 27 settings we tested made 280 to 690 trades. So the result below is about the quality of the strategy. It is not a problem of too few trades.
The idea
We did not pick this strategy because someone online made a claim about it. We picked it to answer our own question.
Our channel trend strategy had two results so far:
- On Bitcoin H4 (4-hour charts) it was real but average. It was the one Bitcoin strategy that made money on out-of-sample data (fresh data we keep for a final test).
- On gold, it failed because gold moved sideways too much.
Our guess was that the strategy works in markets with steady, long-lasting money flows in one direction. EURJPY is the classic carry cross. Traders borrow cheap yen and buy euros to earn the interest difference. This pushes EURJPY up slowly for months. When traders all exit at once, it falls fast, in days. That makes it the strongest "flow" market we have.
The rules:
- Donchian channel breakout: buy when price closes above the highest high of the last N bars. Sell when it closes below the lowest low.
- Trade both directions.
- Exit when price breaks the opposite side of the channel.
- Use an ATR stop loss for disasters. ATR (Average True Range) measures how much price usually moves in one bar.
- Include the real swap costs, which are different for buy and sell trades. Swap is the fee or payment for holding a trade overnight.
A small edge, never good enough
First, the basic channel strategy:
- 14 of 27 settings made a profit.
- The best setting made +$4,993 over 688 trades.
- Faster settings did better.
That last point matters. On gold, it was the opposite: slower settings did better. So the strategy reacts to how each market moves. This suggests the result is probably not luck.
But the best profit factor (money won divided by money lost) in the whole test was 1.17. Our minimum is 1.3. Our selection tools rejected every setting, and they were right to.
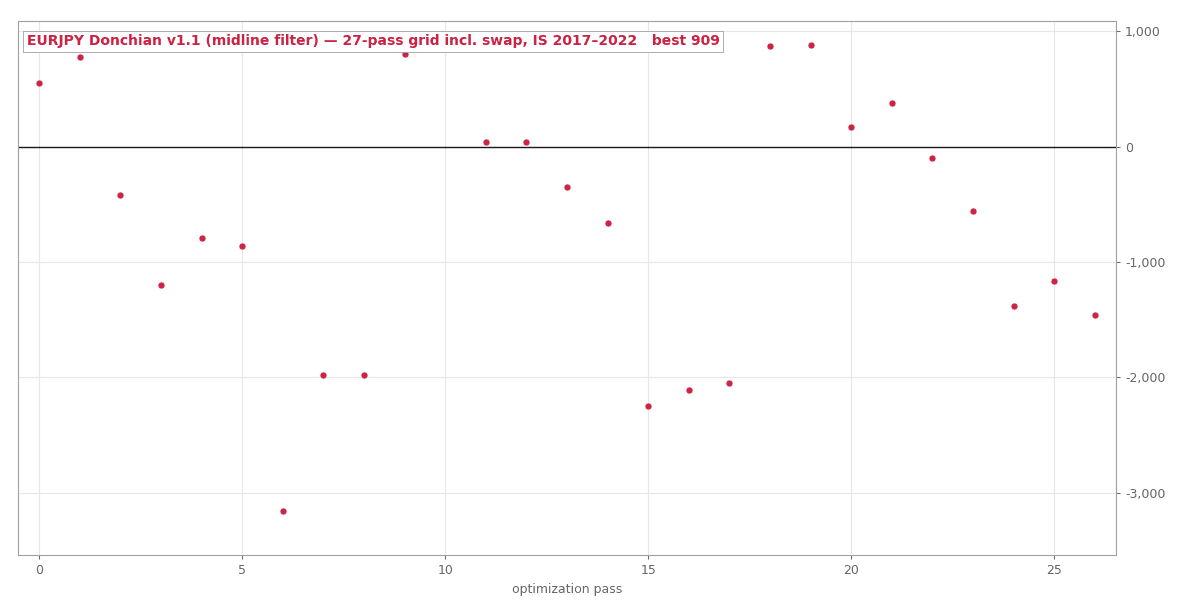
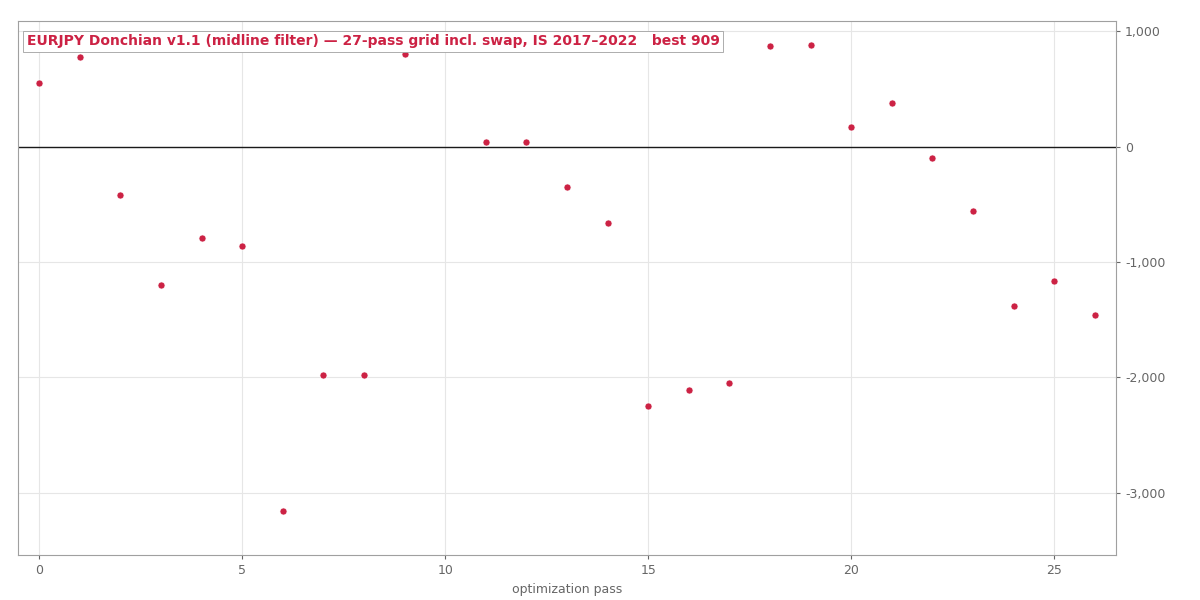 The v1.1 grid, in-sample 2017 to 2022, including swap. Mildly real, never validation-grade.
We allowed ourselves only one extra change, and we planned it before the test. The Bitcoin version used a 50-bar midline filter. It only allows trades in the direction of the bigger trend. We had left it out of the EURJPY version on purpose. Now we added it back. We expected it to remove bad trades in sideways markets and raise the profit factor.
It did the opposite:
- Settings that made money fell from 14 to 10.
- The best profit factor fell from 1.17 to 1.10.
- The best result fell from +$4,993 to +$909.
Why? On a carry cross, many of the winning trades come from the sudden crashes. These trades break out against the earlier trend. A trend filter is designed to remove exactly those trades. So the filter was not part of the strategy's core logic. It was a bet about how the market behaves, and on EURJPY it was the wrong bet.
What this means for trend strategies
We now have four results:
- Bitcoin H4 made money on out-of-sample data, with a profit factor of 1.12, and kept a fair part of its earlier result.
- EURJPY H4 reaches 1.17 at best, on in-sample data.
- Gold H4 made money in 0 of 36 settings.
- H1 (1-hour charts) failed on every market we tried.
So on a single market, our channel trend strategy reaches a profit factor between about 1.1 and 1.36. It never passes our bar for a strategy we would trade.
This matches what trading books say. Trend following makes good returns when you trade dozens of markets together. Twenty average strategies with a profit factor of 1.1 can become one good strategy if they do not have their losing periods (drawdowns) at the same time. On one chart, you get what we keep finding: a small real edge that is too weak, so we keep rejecting it.
So we will stop testing single-market channel trend strategies. If this idea has a future with us, it will be as one part of a portfolio, together with our other near-misses. We will judge it with forward testing (running it on new live prices), not with another round of backtests.
The exact rules of every strategy we've put on trial, how we tested each one, and what the data showed. 12 case files so far, free with your email.
Run the numbers yourself
The free calculators behind the sizing and robustness checks in this test. No signup.