The ICT Silver Bullet Is Sold on a 70% Win Rate. We Measured 36.1%.
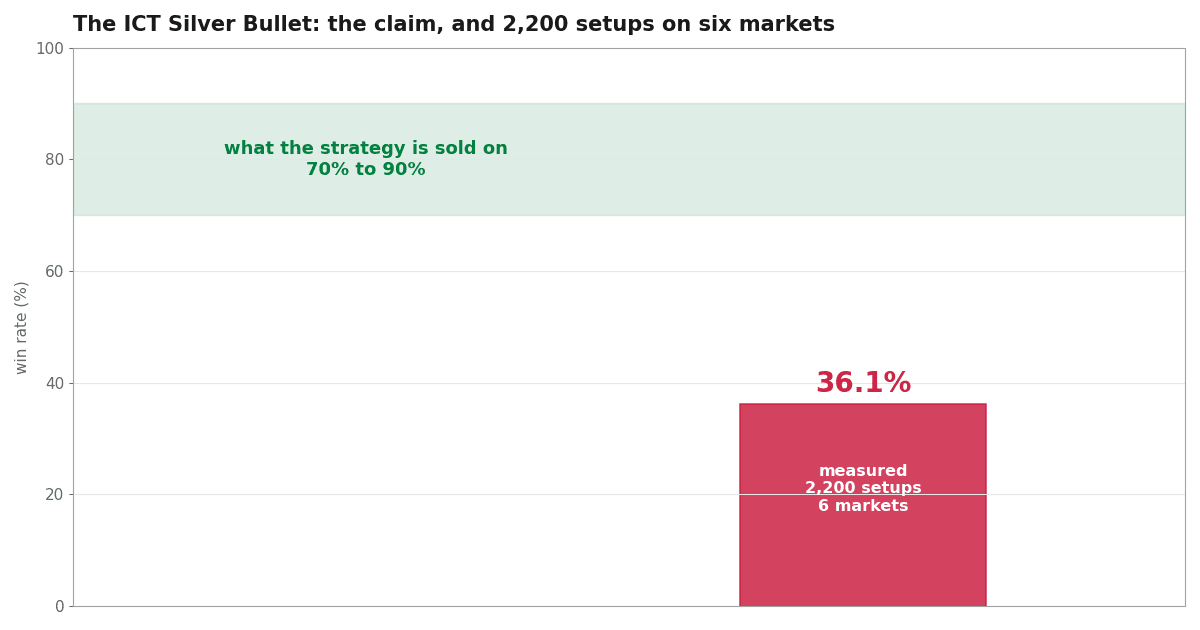
People say the ICT Silver Bullet wins 70 to 90% of the time. We tested all three of its one-hour windows on six markets (three US indices, EUR/USD, GBP/USD and gold) from 2019 to 2021, before writing any strategy code. In 2,200 setups it won 36.1% of the time and lost 0.24R per trade. EUR/USD and gold, which its own teachers recommend, lost more than the indices.
Does the ICT Silver Bullet have a 70% win rate?
No. In 2,200 setups on six markets, from 2019 to 2021, it won 36.1% of the time and lost 0.24R per trade. It lost money on every market and in every time window. The FX pairs and gold lost more than the indices.
What is the ICT Silver Bullet?
ICT stands for "Inner Circle Trader". It is a popular trading style, also called "smart money concepts". Most of its ideas are hard to test. "The market looks for liquidity" sounds nice, but you cannot check it with data and find out if it is wrong.
The Silver Bullet is different. That is why we picked it. It gives you:
- a time window of one hour,
- a setup with clear rules,
- a win rate (how often a trade makes money). Teachers say 70 to 90%.
A number like that can be checked. Either the strategy reaches it, or it does not.
So we measured it. We used six markets, one-minute price data, from 2019 to 2021. This is our in-sample period (the older data we use to study an idea). We did not build an expert advisor (an automatic trading program). We did not touch our out-of-sample data (newer data we keep aside for a final check). If the edge is not in the raw prices, there is nothing to automate.
The rules we used
We wrote down all the rules before we ran anything.
The strategy has three time windows, not one (all in New York time):
- London: 03:00 to 04:00
- New York morning: 10:00 to 11:00
- New York afternoon: 14:00 to 15:00
Most people only test the New York morning window. We did that too, the first time. Testing all three is fair, because this is how the strategy is published.
Inside a window, the setup works like this:
- The price goes past an earlier high or low. This is called a sweep.
- Then the price leaves a fair value gap (a fast move that leaves an empty space on the chart between candles).
- You enter at the middle of that gap.
- Your stop loss (the price where you close a losing trade) goes beyond the sweep.
- Your take profit (the price where you close a winning trade) is at 2 times your risk.
We took one trade per window, per day, per market.
We also decided in advance that we would report all three windows, good or bad. And the main result would be all setups added together, not the best single setting.
What happened in 2,200 setups
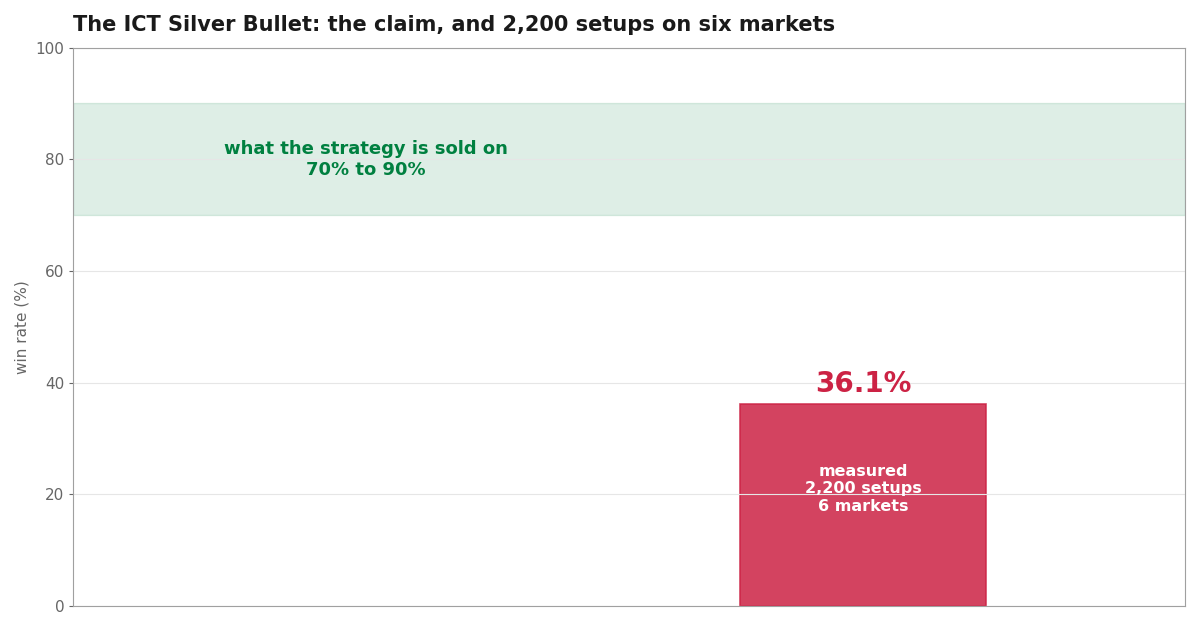 The claimed win rate against the measured one, across 2,200 setups on six markets.
The win rate was 36.1%. Not 70, not 90.
In 2,200 trades, the Silver Bullet won a bit more than one time in three. It lost 0.24R per trade. "R" means your risk on one trade. So 0.24R is about a quarter of what you risk each time.
We also checked the 95% confidence interval. This is the range where the true result most likely sits. It was a loss of 0.29R to 0.19R. The whole range is below zero. So this is not a small sample that is close to break-even by chance. The strategy loses.
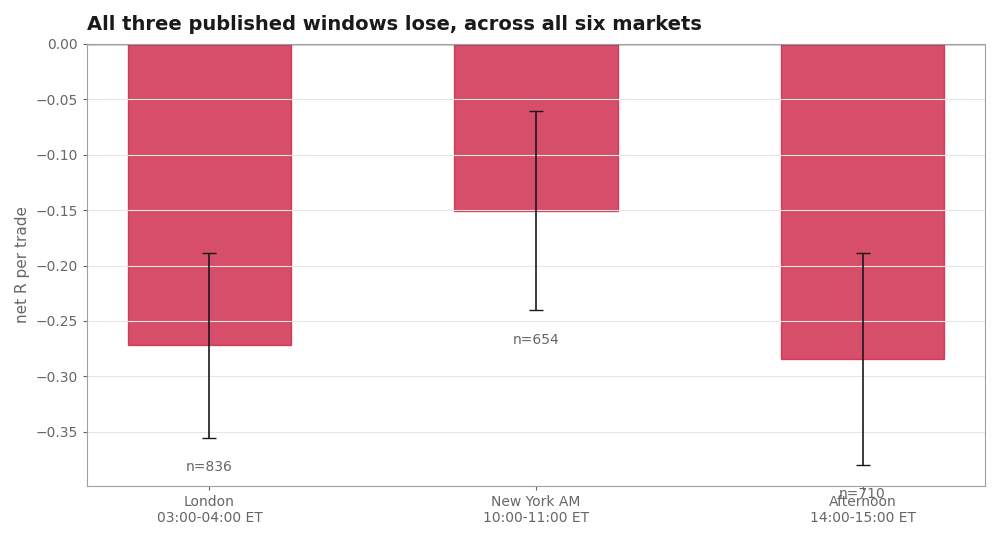 Net R per trade in each of the three published windows, with 95% intervals.
One bad window did not pull down two good ones. All three windows lost money, on all six markets. The window that people teach most is not the best one. This often happens when a strategy becomes popular because it looks good, and not because it works.
We tested the wrong markets first, so we went back
Our first two tests used only index CFDs: Nasdaq, S&P and Dow. That made sense, because the Silver Bullet is best known on NQ and ES futures (Nasdaq and S&P futures).
But it was not complete. We read the strategy's own sources again. They say EUR/USD and GBP/USD are the markets most traded with this setup. They say these pairs give signals in both the London and New York windows. They also name gold as a second market, only for the London window.
We had tested the London window. But we had never tested it on the markets it is meant for. Someone could easily say our verdict was wrong because of this. So we wanted a real answer.
We wrote down the plan before running it:
- same rules and same windows,
- same default settings,
- three new markets,
- both ways of handling fills (see "The limits of this test" below),
- if the result was positive, we would change our verdict.
Trading costs on the new markets are higher. FX and gold pay a commission. Index CFDs do not.
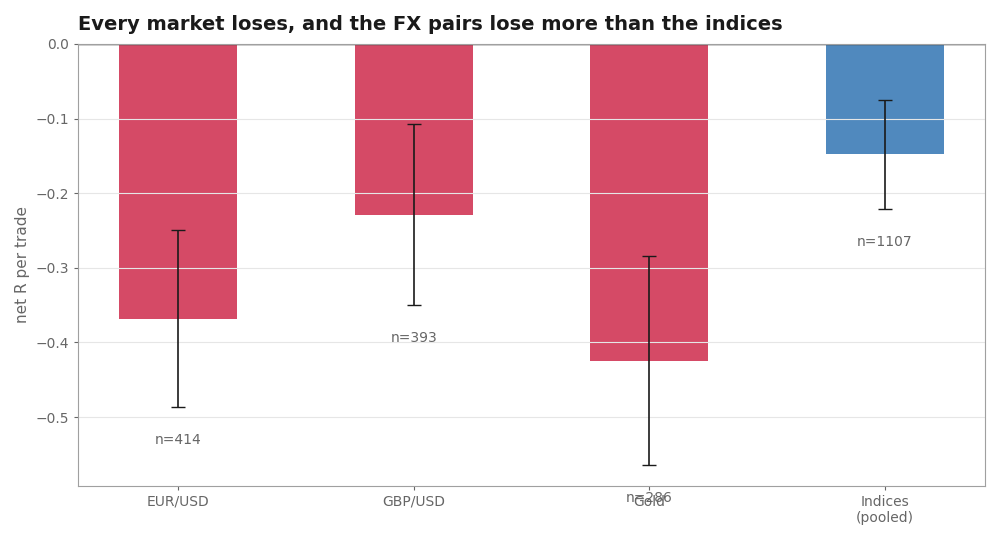 Net R per trade on each market, with 95% intervals.
The FX pairs and gold lost more than twice as much as the indices.
| Market | Loss per trade |
|---|---|
| EUR/USD | 0.37R |
| GBP/USD | 0.23R |
| Gold | 0.42R |
| Three indices together | 0.15R |
All six markets lost money on average, with both fill methods. For EUR/USD, GBP/USD, gold, the S&P and the three indices as a group, we can say with 95% confidence that the result is below zero. For the Nasdaq and the Dow alone, we cannot quite say this. Their range just touches zero. That is why we judge the indices as one group.
So the markets its own teachers recommend are the markets where it does worst.
The exact rules of every strategy we've put on trial, how we tested each one, and what the data showed. 12 case files so far, free with your email.
The sweep: the most important part
A losing backtest is not very interesting by itself. Many decent ideas lose money once you pay the spread (the cost to trade).
The special part of the Silver Bullet is the liquidity sweep. First, the price must take out a high or a low. The idea is that this shows big banks and funds are active. Without the sweep, it is just a gap trade at a certain time of day. The sweep is the reason for the name "smart money".
So we tested the strategy with the sweep rule and without it. If the sweep really helps, taking it away should make results worse.
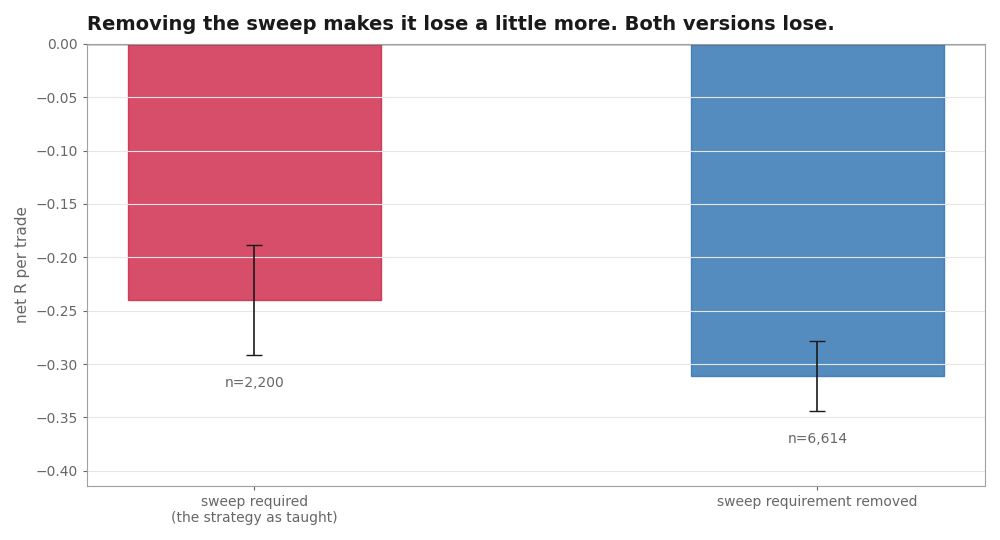 The strategy with the sweep requirement and without it.
Results got worse only a little:
- Within the indices, the difference was too small to separate from random noise.
- Within FX and gold, the same.
- With all six markets together, the version with the sweep lost about 0.07R per trade less. This is just outside random noise.
- Both versions lost money.
We must be careful here. The two versions are not exactly the same except for the sweep. Without a sweep, there is no sweep high or low to put the stop behind. So the version without the sweep must put its stop somewhere else. It also takes about three times as many setups. So this test does not measure the sweep alone, and we do not claim it does.
But it does show one clear thing. The filter that gives the whole method its name helps a little at most. It is not nearly enough to turn a losing setup into a winning one.
Our mistakes along the way
We tested this once before, on 2026-08-02. We used only the New York morning window. That test had 321 trades. We wrote down two results from it: a profit or loss in dollars per trade, and a finding that the sweep made the Nasdaq worse.
Then someone checked the statistics separately, and both results failed:
- With 321 trades, the dollar result had a range from $6.37 loss to $4.35 profit per trade. That range tells us nothing.
- The sweep comparisons had p values of 0.52, 0.29 and 0.80. A p value this high means the result could easily be luck.
- Only the win rate result was still valid.
So we added all three windows, and later all six markets. Each step made the sample about twice as big. We still did not use any out-of-sample years. The win rate went from 42.1% to 36.9% to 36.1% as the sample grew. It never came close to 70.
The limits of this test
- Only three years. This is in-sample data, on purpose. Maybe the strategy works in some later period. We did not test that. But the teachers do not claim this either.
- CFDs, not futures. We used index CFDs, not the NQ and ES futures the strategy was first made for. Futures have lower costs than CFDs. So a futures trader pays less than our test charged. But this does not save the result. Even with zero costs, the strategy is still a little negative. There is no edge that cheaper trading could find.
- Unclear bars. Sometimes one one-minute bar touches both the stop loss and the take profit. We do not know which came first. We counted these as losses. This is the careful choice, and it makes a losing strategy look a little worse. We also ran it the other way (counting them as wins). The total result almost did not change.
The verdict
No edge. We tested 2,200 setups on six markets and in all three published windows. The ICT Silver Bullet:
- wins 36.1% of the time, not the claimed 70 to 90%,
- loses 0.24R per trade, and the whole confidence range is below zero,
- loses money on every market and in every window we tested,
- does worst on the markets its own sources recommend most.
The liquidity sweep, which gives the strategy its name, helps a little at most. The strategy loses money with it and without it.
We did not use the out-of-sample years. There was no reason to.
The exact rules of every strategy we've put on trial, how we tested each one, and what the data showed. 12 case files so far, free with your email.
Run the numbers yourself
The free calculators behind the sizing and robustness checks in this test. No signup.