A Gold System With 28 Years of Published Results Met Our Tester. The Gradient Told the Real Story.
A gold breakout system with a trend filter claims a profit factor of 1.85 over 28 years, with costs. Our best test got 1.14 over 104 trades. Results got better each time we made the system slower. But the edge seems to live at a speed too slow for us to test properly.
Does the gold chandelier breakout system really have a 1.85 profit factor?
Not on our data. The published system claims 1.85 over 28 years. We tested it on 2019 to 2022 tick data on the H4 chart. The best of 36 settings reached 1.14 over 104 trades. Our minimum is 1.30 and 150 trades. Results got better as the system got slower.
The system we tested
The user asked us to find a strategy with good published results and test it in our process. The best-documented one we found was a gold breakout system. It shares numbers that most sellers never show:
- Market: XAUUSD (gold), daily chart
- Period: April 1998 to March 2026
- 104 trades, win rate 40.38%
- Profit factor 1.85 (gross profit divided by gross loss)
- Commission and slippage included in the results
The rules are public too:
- Entry: buy when the price closes above the highest high of the last 20 days (a Donchian breakout). Only buy when an EMA (a moving average) trend filter also points up.
- Exit: use a chandelier trailing stop. The stop sits at the highest high minus a multiple of ATR (the average size of a price bar). It can only move up, never down.
What we had to change
Two things needed changing.
First, the exact settings of the system are behind a paywall. This matters less than it sounds. Our process finds the best settings itself on the in-sample data (the data we use to build and tune a strategy).
Second, and more important, the system trades too rarely. On the daily chart it makes about four trades a year. Our minimum is 150 trades in the in-sample data. Below that, the test result does not mean much statistically.
So we tested the same rules on the H4 chart (4-hour bars), with channels of 10 to 40 bars. We wrote this change clearly in our plan before testing.
The code worked. The edge did not appear.
First we ran a quick test on the 2020 gold rally. This was the system at its best:
- Nine trades, profit factor 1.93
- Every winning trade closed on a stop that had moved above the entry price. This is exactly how a chandelier exit should work.
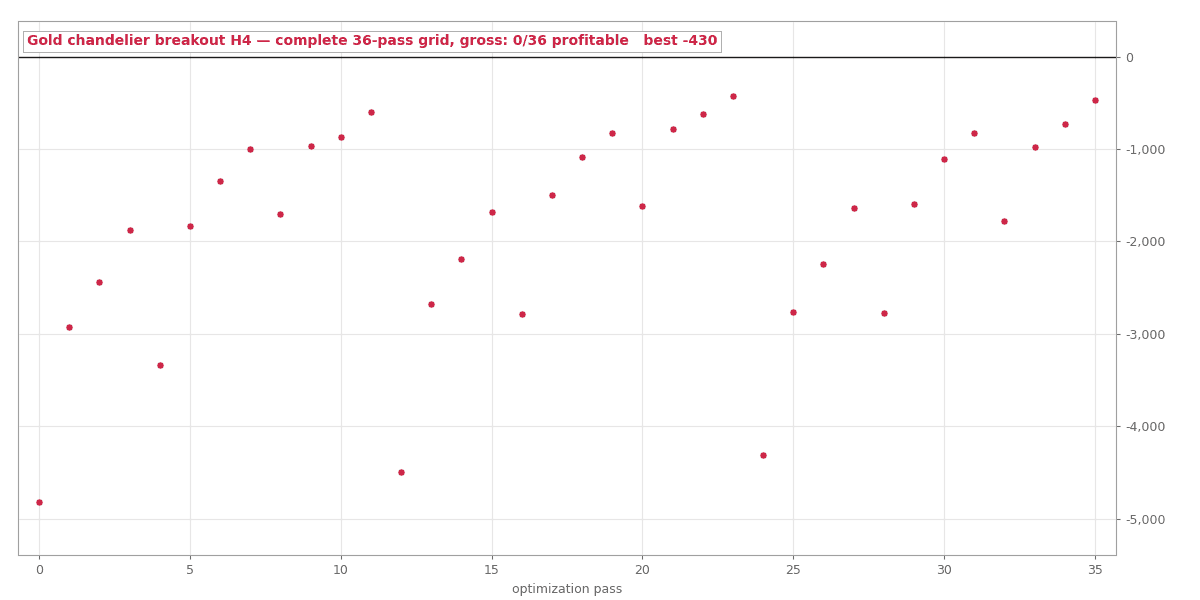
Then we ran the full test, 2019 to 2022, with 36 different settings:
- 16 of the 36 settings made money.
- The best one made only +$742 on $10,000, over 104 trades.
- That is a profit factor of 1.14.
To get an out-of-sample test (a test on new data the strategy was not built on), a strategy needs a profit factor of 1.30 and at least 150 trades. No setting came close.
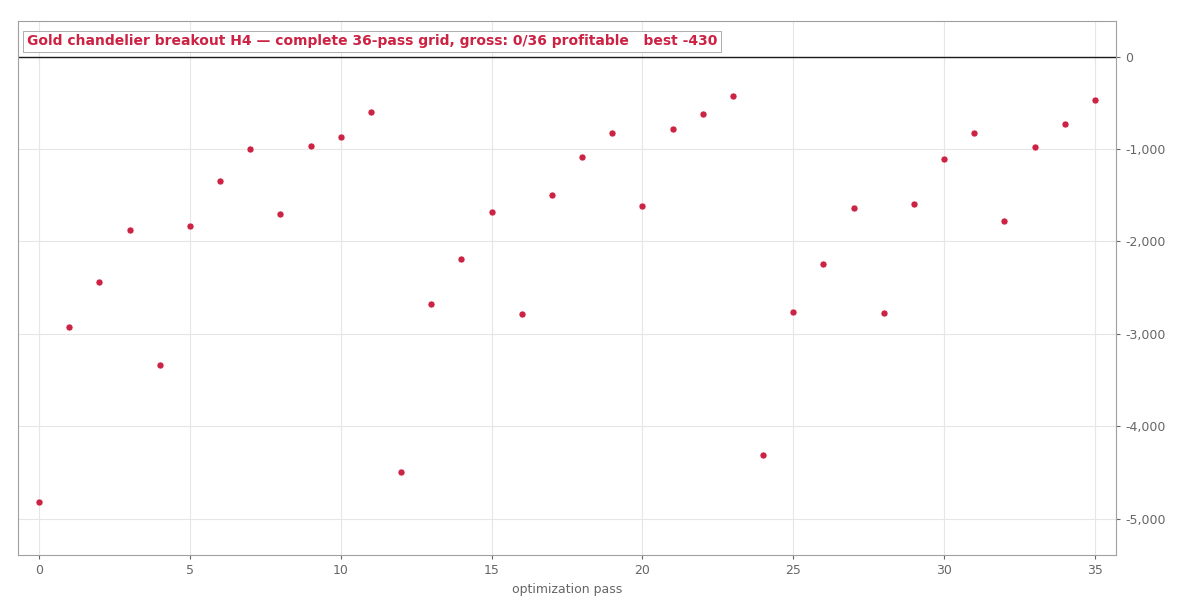 The complete 36-pass H4 grid, 2019 to 2022.
Slower was always better
The interesting part is the pattern in the results. Slower entry channels did better every single time. The average result went from minus $940 with 10-bar channels to plus $416 with 40-bar channels.
The width of the trailing stop made almost no difference. The EMA filter is the main improvement the source talks about. In our test it changed nothing, at any EMA length we tried.
So step by step, the data points back to the daily chart, where the source system runs. And that is exactly where our tests cannot follow. At 40 H4 bars, the system makes only about 100 trades in three years. That is two thirds of our minimum. And the results suggest it should be even slower.
If gold has a trend edge, it seems to work only at a slow speed. At that speed, one market cannot make enough trades to test the edge properly.
One test at the original speed
So we ran the system once at the source's own settings, only on our in-sample data, just to see what happens:
- 20-day channel
- 22-day chandelier at 4x ATR
Result for 2019 to 2022: 39 trades, net plus $357.53, profit factor 1.209. So it made a small profit with real costs in our period. But it made only a third of the trades any of our tests would need.
The source describes its own equity curve, and that explains the difference. They say it was a "slow escalator" from 1998 to 2020, and then went "vertical" after 2020. So most of the 28-year profit came from a few strong trend periods. Our test period happens to include the sideways market that the system pays for between those trends.
What we learned
Gold channel systems have now failed our minimum standards twice. We tried two strategies at three different speeds. The same rules did work on Bitcoin on the H4 chart, though the results were only average there.
What we see: trend following acts like a different strategy at each speed, and each market works best at its own speed.
We did not give up. We changed our process. For slow strategies that make 30 to 50 trades a year, we decided in advance to use a longer in-sample period: 2017 to 2022. So the next slow idea gets five years of data instead of three. All our quality rules stay the same.
For anything slower than that, we cannot test it honestly on one market. It does not matter what the published numbers say.
The exact rules of every strategy we've put on trial, how we tested each one, and what the data showed. 12 case files so far, free with your email.
Run the numbers yourself
The free calculators behind the sizing and robustness checks in this test. No signup.