Sixteen Strategies Failed Our Gates. The Four Best Losers, Combined, Passed Everything.
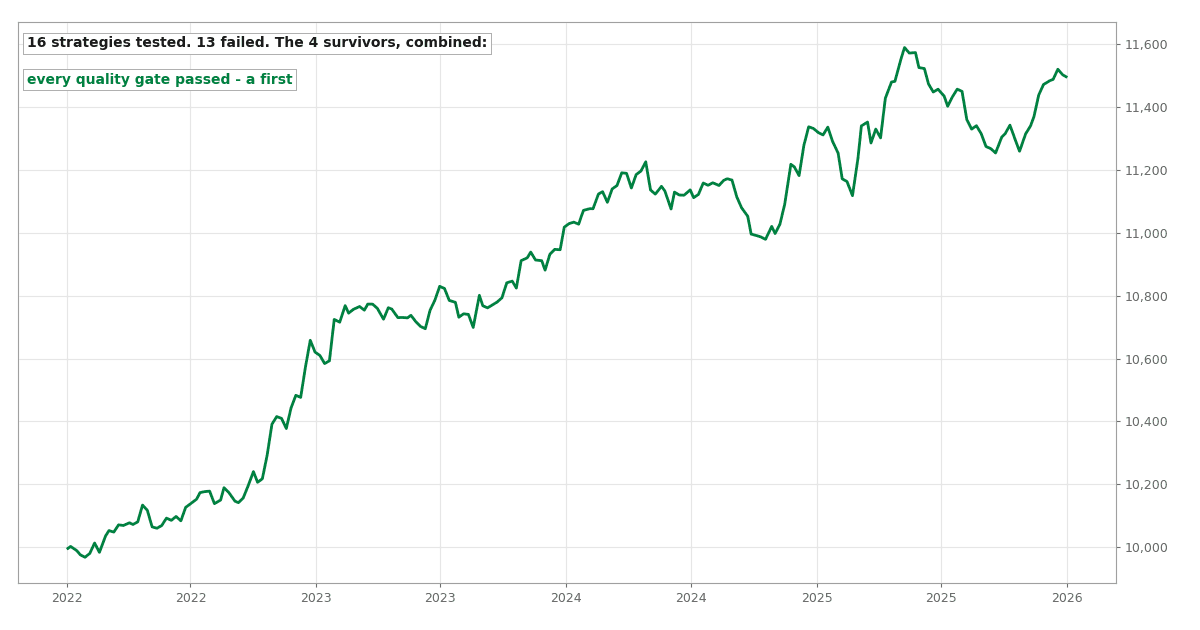
We tested 16 published trading strategies on real tick data. Four had a real edge but failed our tests on their own. We combined them with weights we chose before the test. Together, they pass all 14 of our tests.
Can strategies that fail on their own work as a portfolio?
In our test, yes. Four strategies had real but small edges, and each one failed alone. Combined with weights we fixed in advance, they passed all 14 of our tests: a profit factor of 1.23 and a biggest drop of only 3.2%. Their daily results almost did not move together (average correlation -0.01).
Where we started
Since we started this project, we have tested sixteen published trading strategies. Every strategy went through the same process:
- Real Dukascopy tick data (every single price change).
- Commission and swap (the fee for holding a trade overnight) included.
- We chose settings only on 2019-2022 data.
- Then we gave each strategy one try on 2022-2026 data that we kept hidden. This is called "out-of-sample" (OOS) data.
- Last, the strategy had to pass a set of quality tests (we call them gates). Until now, no strategy had passed all of them.
Thirteen strategies failed completely. You can read about all of them on this site.
Four strategies kept a real edge on the hidden data, but they still failed. Each one failed a different test.
Two terms help with the table. Profit factor (PF) is total money won divided by total money lost. Above 1 means profit. Max drawdown is the biggest drop from a high point.
| strategy | type | OOS profit factor | max drawdown | why it failed alone |
|---|---|---|---|---|
| Gotobi Tokyo fix | seasonality | 1.36 | 7.0% | kept only 67% of its in-sample PF, bar is 70% |
| WMR fix reversal | mean reversion | 1.23 | 2.2% | real, but pays ~0.7% a year |
| Asian range breakout | session breakout | 1.16 | 23.7% | drawdown past our 20% cap |
| BTC Donchian trend | trend | 1.12 | 25.2% | PF, drawdown and Sharpe all just under |
Four real edges, and four rejections. We asked a new question: what if we are judging the wrong thing? Maybe we should judge the group, not each strategy alone.
An old idea, used on our own rejected strategies
These four strategies are very different:
- a seasonal (calendar) edge on USD/JPY
- a trade against the price move around a daily fix on GBP/USD
- a breakout from a trading session's range
- a trend strategy on Bitcoin
There is no reason for them to lose money on the same days. We measured it. The average correlation between their daily profits and losses is -0.01. Correlation shows how much two things move together. Zero means they do not move together at all. So these are like four separate coin flips, each a little in our favor.
Spreading money across things that do not move together is called diversification. It is the oldest "free lunch" in finance. The math has been known for seventy years.
The hard part is being honest. If you build a portfolio AFTER you see the results, you can make anything look good. That is just curve fitting (fitting the rules to past data) with extra steps. So we wrote the rules down first:
- We chose the strategies by a rule. Every strategy whose edge held on the hidden data was included automatically. We did not pick favorites.
- We set the weights using only in-sample data. We used volatility parity: each strategy gets a weight so that each one moves the account by a similar amount. We calculated it on 2019-2022 and fixed it before we saw any combined result. The weights: WMR fix 54.1%, gotobi 38.1%, BTC Donchian 4.2%, range breakout 3.6%.
- One try only. No new weights, no swapping strategies, no second try after seeing the result.
- We fixed the benchmark formula in advance. So we could not choose an easy comparison after the fact.
The exact rules of every strategy we've put on trial, how we tested each one, and what the data showed. 12 case files so far, free with your email.
The results
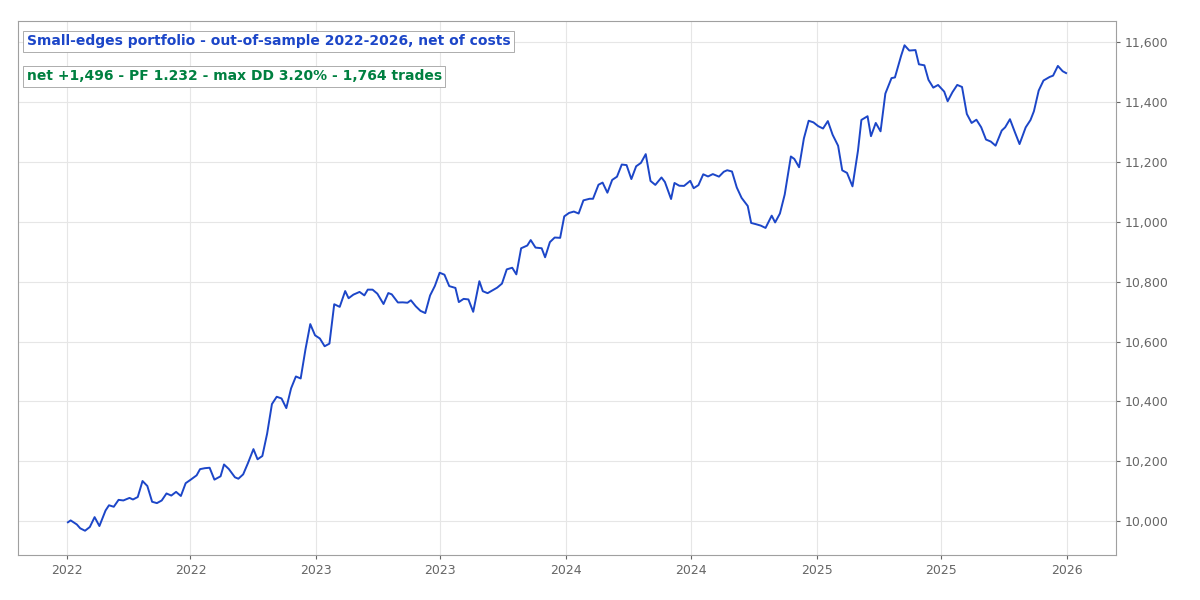 The combined out-of-sample equity curve, 2022-2026, after modeled costs.
- Profit factor after costs: 1.232. That keeps 87% of the in-sample value.
- It made money in all four out-of-sample years.
- It still made money when we raised commission from $3.50 to $8.50 per side.
- It made 1,764 trades.
This drawdown chart shows the main point in one picture:
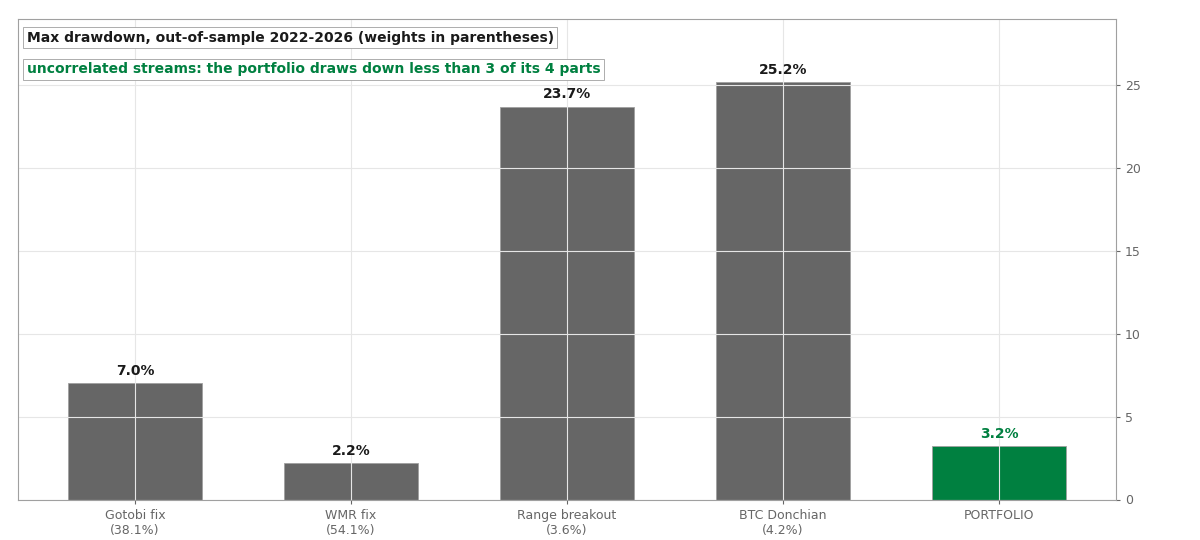 Max drawdown for each strategy and for the combined portfolio, out-of-sample.
Two of the strategies dropped 24-25% on their own. The combined portfolio never lost more than 3.2% from a high point. Why? The four strategies have their losses at different times. We did not hedge anything or time anything. The near-zero correlation did all the work.
To check how much of this is luck, we replayed the 1,764 trades ten thousand times, in random samples and random orders. This test (called a bootstrap) puts the profit factor between 1.05 and 1.44. There is only a 0.4% chance that the whole period loses money. You can try it yourself:
Each run reshuffles the 1,764 out-of-sample trades, drawing them with replacement, and totals the result. The blue line is what actually happened; the shaded band left of zero is every run that ended in the red.
Last, we compared it with simple choices. The benchmark was a weighted mix of two things on the same markets: buy-and-hold, and a very simple momentum rule. The portfolio gave 3.9 times the return for the same risk. So it passed fourteen tests out of fourteen. No strategy on this site had done that before.
The warning we wrote down before we saw the result
Many people would hide this part. We put it in bold instead: we chose the four strategies because they already did well on the hidden data.
The combined result uses data on which every strategy was already judged. So this study shows how known edges work together. It is not a test on fresh, unseen data. Passing all the tests does not change that. We wrote this sentence down before the test, together with the weights.
There is only one test you cannot prepare for: the future. This portfolio's strategies are taking that test now. Two of the four already run on a demo account. We publish every trade on our forward test tracker when it closes.
The return is small on purpose. It is about 3.6% a year with these careful weights, which add up to one. Using leverage (borrowed money to trade bigger) is a separate decision, and we are not making it here.
What matters here is the shape of the result. Four small, honest edges, tested the hard way, add up to one steady edge.
After sixteen strategies, our pile of failed tests finally gave us more than lessons.
The exact rules of every strategy we've put on trial, how we tested each one, and what the data showed. 12 case files so far, free with your email.
Run the numbers yourself
The free calculators behind the sizing and robustness checks in this test. No signup.