Gotobi on EUR/JPY: We Changed Nothing and It Still Worked
We took the gotobi rules validated on USD/JPY, froze every parameter, and gave EUR/JPY exactly one out-of-sample shot. Profit factor 1.42, all four years positive, and one warning sign we are not hiding.
The most dangerous button in a backtesting platform is the one labeled "optimize". Every press makes the market you are studying a little more imaginary. So when we found a reason to test our Tokyo-fix strategy on a second currency pair, we made ourselves a promise before looking at a single result: press nothing. Frozen rules, one shot.
It passed.
The mechanism, briefly
Japanese import companies settle invoices on calendar days divisible by five. The gotobi days. Their banks buy dollars against yen ahead of the 9:55 JST Tokyo fix on those mornings, and that scheduled buying pressure leaves a measurable drift in the hours before the fix. Ito and Yamada documented it academically; we validated it on USD/JPY with a profit factor of 1.36 out of sample.
That mechanism is a yen story, not a dollar story. Importers sell yen. If the flow is real, any yen cross should feel it on the same calendar, and EUR/JPY inherits the pressure through its yen leg without us touching a single setting.
That gave us a rare opportunity. Most backtests answer "did these parameters fit this market?" A frozen transfer answers something better: "is the mechanism real?"
The discipline: zero knobs turned
We inherited every parameter from the USD/JPY strategy. Enter long EUR/JPY at 15:55 UTC the evening before a gotobi day, nine hours before the fix. Exit at the fix, 00:55 UTC, win or lose. A 60-pip catastrophe stop, a 3-pip spread filter, one trade per gotobi day, 1% of equity at risk. The dates shift to the preceding business day when the fifth lands on a weekend, following Japanese settlement convention.
No optimizer ever saw EUR/JPY. The pair got exactly two test runs on real tick data: one in-sample confirmation, one out-of-sample verdict. That is the whole history.
The in-sample window, 2019 through 2021, confirmed the drift with 213 trades and a 1.56 profit factor, net of commission and swap:
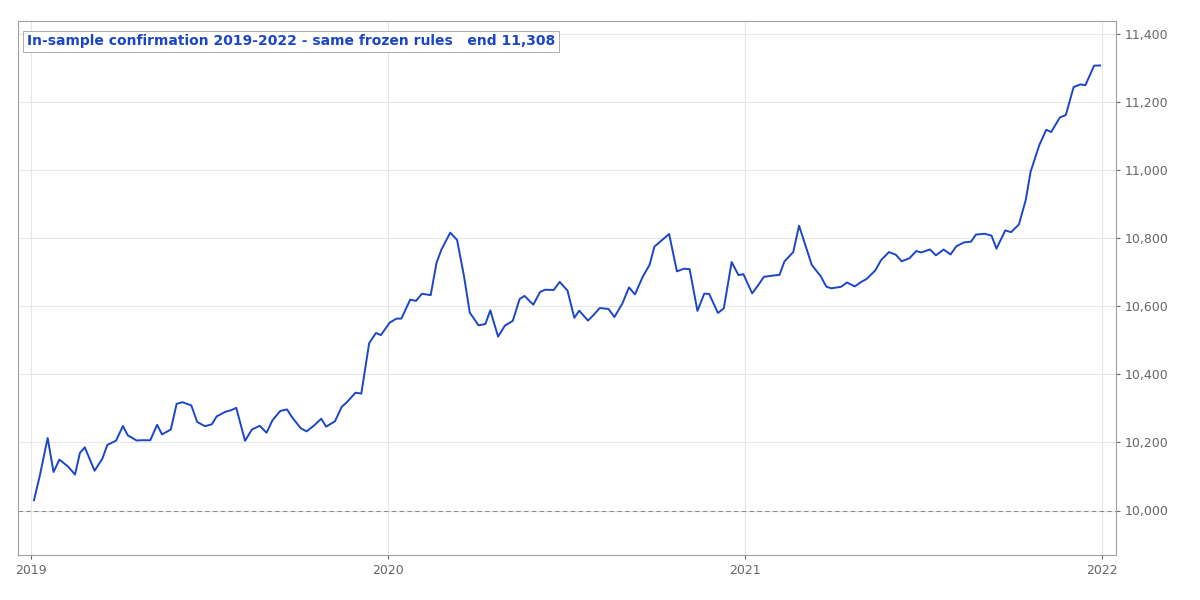 In-sample confirmation, 2019-2021: $10,000 grows to $11,308 on frozen rules
The one shot that counts
Then the holdout: 2022 through 2025, four years the rules had never seen, on a pair the rules were never built for.
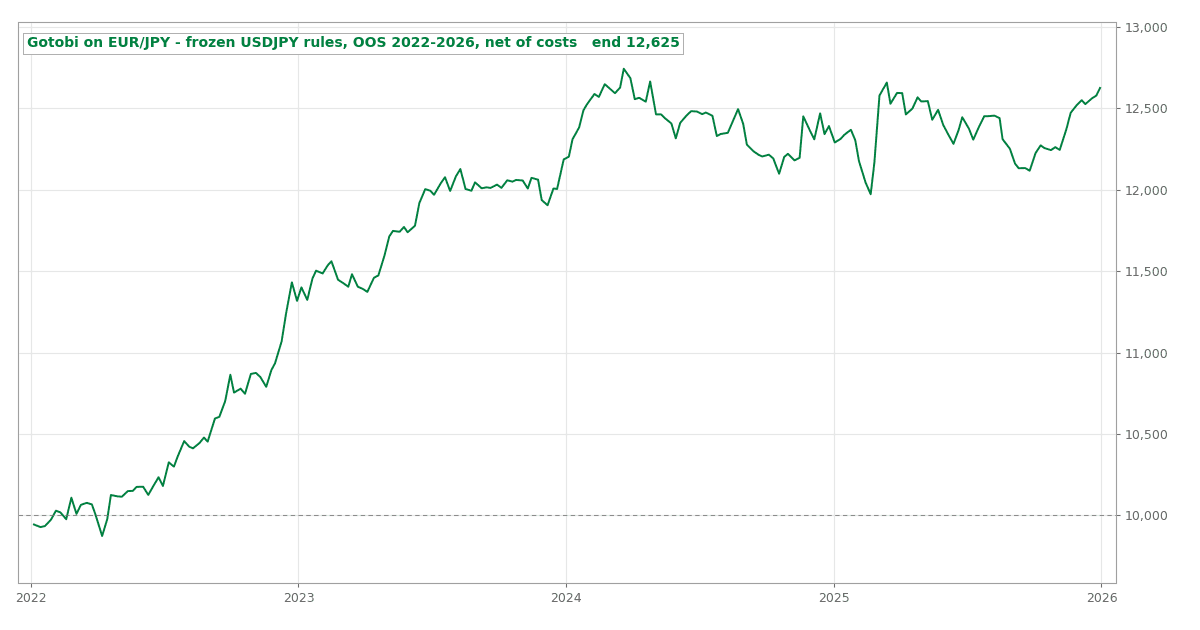
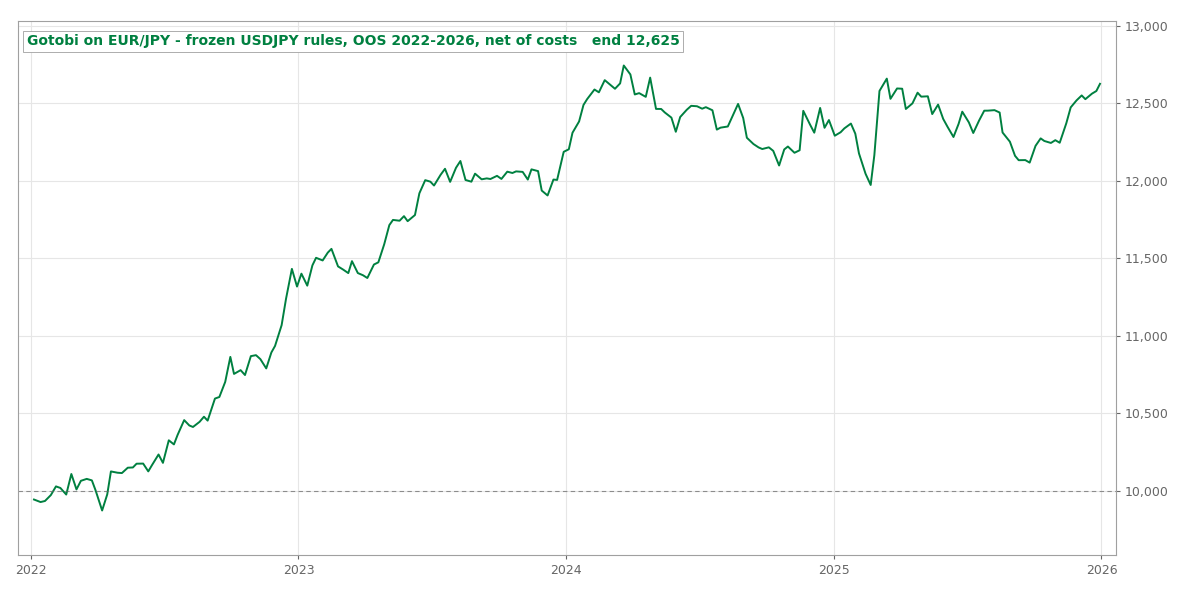 Out-of-sample equity 2022-2026: $10,000 to $12,625 net of all costs
283 trades. Profit factor 1.42. Win rate 54%. Maximum drawdown 6.1%. Net profit $2,625 on a $10,000 account risking 1% per trade, after commission and swap. Every single year finished positive:
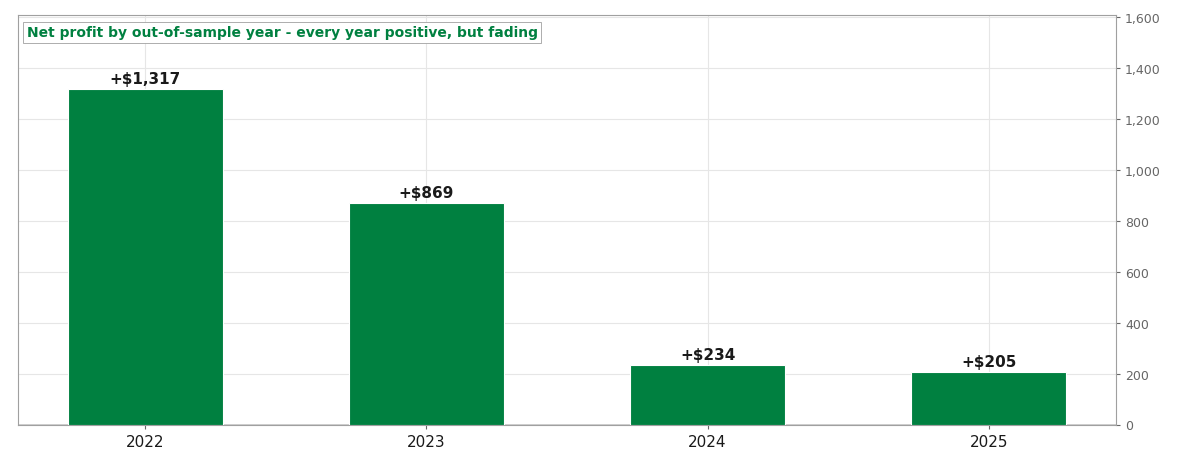 Net profit by year: +$1,317, +$869, +$234, +$205
And there is the honest part of this post, sitting right in that chart. 2024 and 2025 earned a fraction of 2022. The USD/JPY original showed the same decay direction. The effect is alive, and it is fading. We are saying both things at once because both are true, and the chart would betray us anyway if we tried to say only one.
How much of this was luck?
A single equity curve is one shuffle of the deck, so we resampled the 283 trades ten thousand times. The probability that this trade distribution nets a loss over the window: 1.4%. The 95% confidence interval on net profit runs from +$331 to +$5,019, positive even at the unlucky edge. Reshuffling the trade order puts the 95th percentile drawdown at 9.3%, so quote that figure, not the realized 6.1%, if you want the cautious number. Explore it yourself:
Each run reshuffles the 283 out-of-sample trades, drawing them with replacement, and totals the result. The blue line is what actually happened; the shaded band left of zero is every run that ended in the red.
The objection you should raise
"You were long EUR/JPY from 2022 to 2025. The yen collapsed. You just rode the trend."
Fair challenge, and the reason we benchmark. Buy-and-hold EUR/JPY over the same window returned 8.9% a year with a 10.9% drawdown, a MAR of 0.81. The strategy returned less in absolute terms, 6.0% a year, but with a 6.1% drawdown its MAR is 0.99. Risk-adjusted, the strategy beat holding the pair by 1.22x:
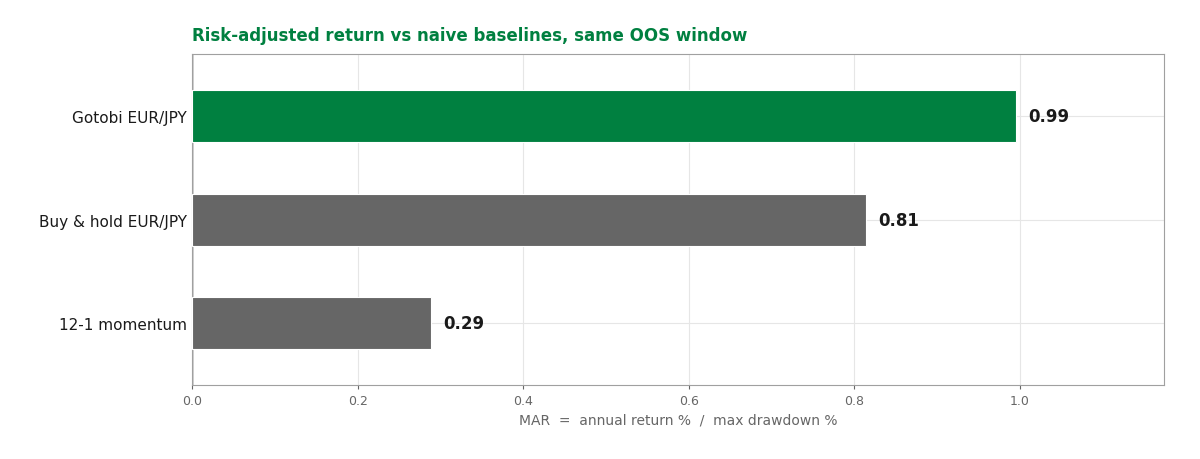 MAR comparison: strategy 0.99, buy-and-hold 0.81, momentum 0.49
The stronger version of the answer is arithmetic. The strategy is in the market about 7% of the time. If its profit were just drift, that exposure would have captured roughly 0.65% a year. It captured 6.0%. The pre-fix window carries about nine times the pair's unconditional drift, which is exactly what a real settlement flow should look like, and it also matches the in-sample years, when the yen went nowhere and the strategy still made money.
The second objection, one layer down
A reader raised this one on the USD/JPY version of the strategy, and it applies here too. "You held long EUR/JPY overnight and collected positive swap for it. MetaTrader charges today's swap rate across the whole backtest rather than the rate that applied on each night, so part of that curve is carry the trade would never have earned at the time."
Correct on the mechanism, and smaller on this pair than on the dollar-yen original. Swap was $263 of the $2,625 net, about 10%. The tester reports it as its own column on every deal, so removing it is arithmetic rather than another test run. With carry set to zero the four years still net $2,362, or +23.6%, at a 1.37 profit factor, and all four years stay positive: +$1,255, +$807, +$164, +$137. Profit-factor retention from in-sample to out-of-sample improves slightly, from 91% to 93%. Per lot, the price move is worth $36.51 against $3.28 of swap.
Carry rounds the edges of this result. It does not create it. The full version of the correction, where it matters considerably more, is in the USD/JPY post.
What happens next
Next stop is a live demo forward test, which will settle whether the fade we see in 2024 and 2025 continues. Until then, the full trade-by-trade record, every gate, and the exact parameters are on the results page.
We changed nothing and it still worked. Whether it keeps working is the forward test's job.
Run the numbers yourself
The free calculators behind the sizing and robustness checks in this test. No signup.