Timing Gold With the 50-Day Average Made Money. Just Holding Made More.
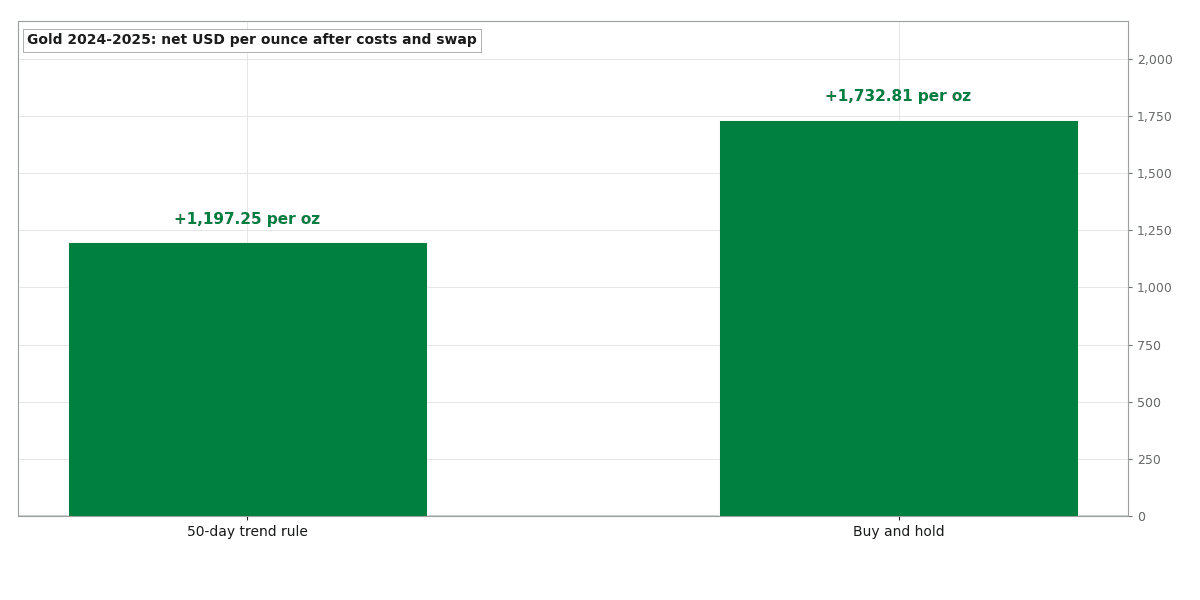
A long-or-flat rule on gold's 50-day moving average should keep the bull run and dodge the drops. On 2024 to 2025 data with full costs it made +1,197.25 per ounce. Buy-and-hold made +1,732.81, with the same worst drawdown.
Does a 50-day moving average rule beat buy-and-hold on gold?
Not in 2024 to 2025. Holding gold only while it closed above its 50-day average made +1,197.25 per ounce after spread, commission and swap, over 22 trades. Simply holding gold made +1,732.81 per ounce. Both had the same worst drawdown, 443.42 per ounce, so the rule earned 2.70 for every unit of drawdown against 3.91 for holding. We rejected it and kept the 2026 data sealed.
The Backtest Files: the exact rules of each strategy we've put on trial, how we tested it and what the data showed. Free with your email.
The claim
Gold has been in a huge bull run, and the usual advice for a run like this sounds sensible: ride it while it lasts, and step aside when it ends. The simplest way to do that is a moving average. Stay long while price is above it, get out when price closes below it. The idea goes back at least to Mebane Faber's 2007 paper "A Quantitative Approach to Tactical Asset Allocation", which used a 10-month average. We used a faster one, the 50-day average, because it reacts within weeks instead of months.
The case for it on gold: the 2024 to 2026 rally is driven by central-bank and ETF buying, so it should trend. A rule that holds the trend and goes to cash when it breaks should keep most of the gains and skip the deep drops. That would mean more profit for every pound of pain than just holding.
That last part is the whole point. Anyone can make money being long gold in a bull market. The question is whether the timing adds anything.
What we tested
- Market: gold (XAUUSD), daily closes built from one-minute Dukascopy data on the UTC calendar day.
- Period: 2024 and 2025.
- The rule: if today's close is above the average of the last 50 closes, buy at the next day's open. If a close comes in below it, sell at the next day's open. Long or flat, never short, no stop loss.
- Costs: 0.27 per ounce per round trip (spread plus commission) and the overnight swap for every night held, 0.62635 per ounce, three times on Wednesdays.
- The comparison: buying gold on the first day and holding it to the end, with the same swap and one round-trip cost.
- The bar, written down before we looked at any data: the rule must make money, and its profit divided by its worst drawdown must be at least as good as buy-and-hold's. Both are measured per ounce, marked to market every day.
We also kept January to July 2026 back as a second test. A rule only gets to see those months if it passes on 2024 and 2025.
What came out
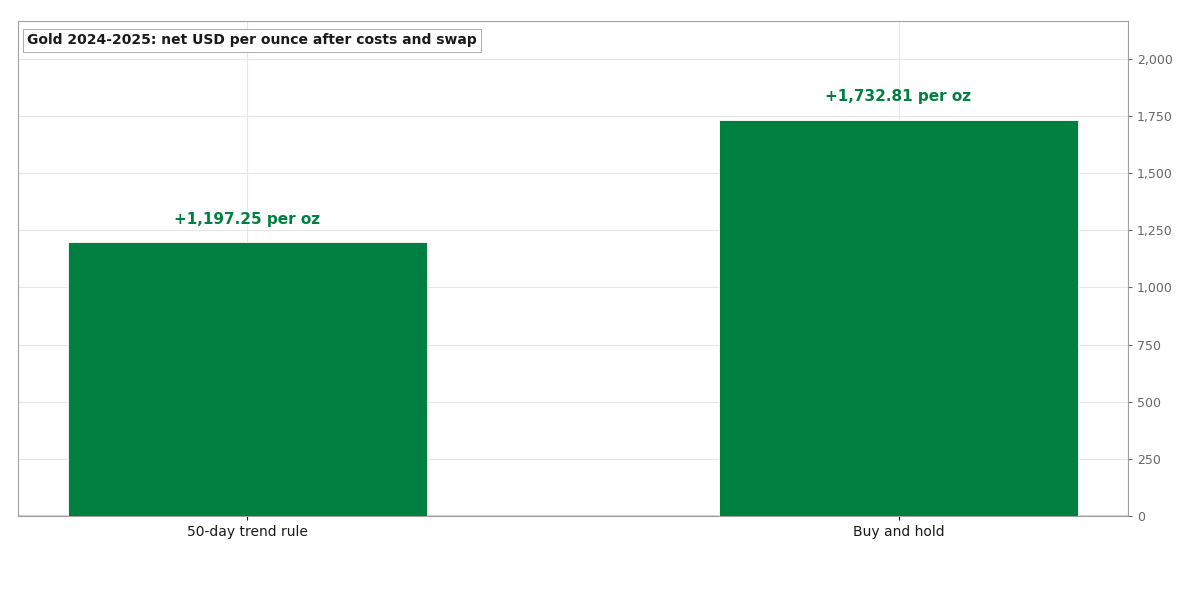 Net profit per ounce, 2024 to 2025, after costs and swap
The rule worked in the plain sense. It traded 22 times and made +1,197.25 per ounce after all costs. Holding gold over the same two years made +1,732.81 per ounce.
That alone isn't the failure. A timing rule is allowed to make less, as long as it takes much less pain to get there. So the real test is the worst drawdown, and this is where it broke:
- 50-day rule: worst drawdown 443.42 per ounce
- Buy-and-hold: worst drawdown 443.42 per ounce
The same number, to the cent. The rule gave up a big part of the profit and saved nothing on the way down.
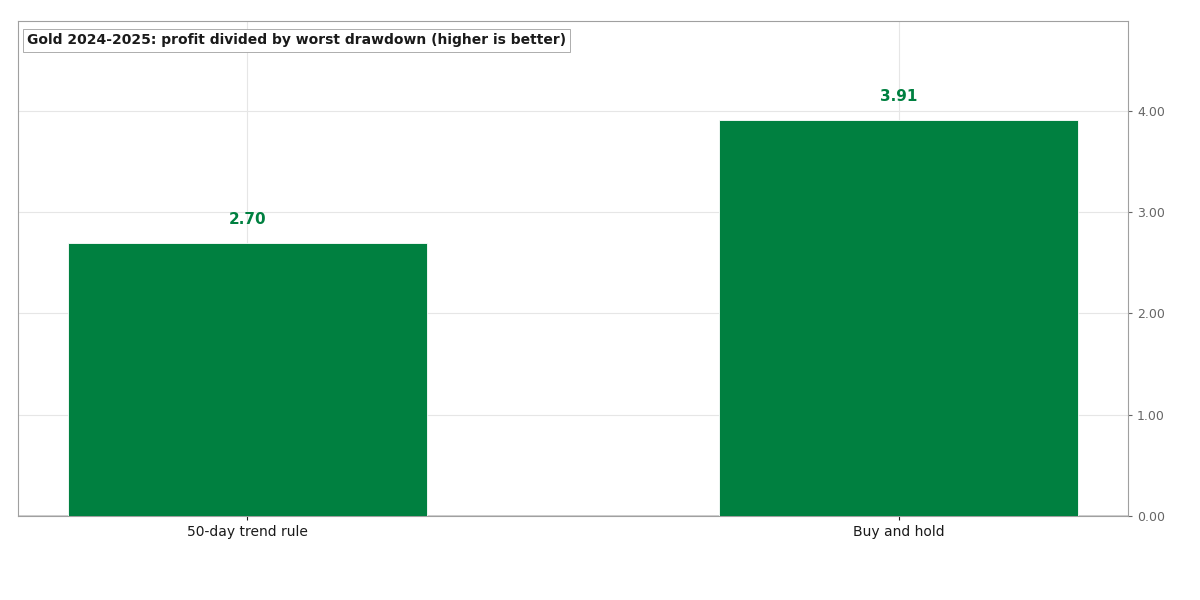 Profit divided by worst drawdown, 2024 to 2025
Profit per unit of drawdown came out at 2.70 for the rule and 3.91 for holding. The bar was to match or beat holding. It missed, so we rejected it.
Why it failed
Two things went wrong, and both are about how this gold market moved.
It sold dips that came straight back. Every time gold dipped below its 50-day average, the rule sold. In 2024 and 2025 most of those dips recovered, so the rule sat out the bounce, bought back in once gold was above the average again, and paid the costs of another round trip. From the second quarter of 2024 on, it trailed buy-and-hold.
It was long for the worst drop. The deepest fall in the test came in October 2025, 443.42 per ounce from the peak. The rule was long when it came and took the whole hit, same as just holding. A 50-day average is slow by design: it gets you out after a fall, not before it.
That is the trap with a trend filter in a strong bull market. It pays for protection on every small dip and then isn't there for the big one.
What we did not do
We never ran the rule on January to July 2026. It failed on 2024 and 2025, so those months stay sealed, and we didn't try other averages to find one that would have passed. Tuning the length after seeing this result would just fit the rule to these two years.
So this is a test of one fixed rule on one market over two years. It says nothing about the 10-month version in Faber's paper, or about other markets.
The lesson
Before you time a trend, check if holding it was better. A strategy that makes +1,197.25 per ounce looks like a win on its own. Next to +1,732.81 for doing nothing, with the same worst drawdown, it is a cost. Always put buy-and-hold next to a trend rule, and compare the drawdowns, not just the profit.
Which strategy should we test next? You can see every strategy we tested, winners and losers, on the results page. We tested other gold trend ideas too, like the gold chandelier breakout and the gold stairway breakout.
Past performance does not mean future results. This is a backtest with real trading costs. It is not a live trading result.
The exact rules of every strategy we've put on trial, how we tested each one, and what the data showed. 12 case files so far, free with your email.
Send us your rules or your MT5 EA. We run them through the same tests as this post, with real broker costs and data the strategy has never seen, and give you a plain verdict.
Run the numbers yourself
The free calculators behind the sizing and robustness checks in this test. No signup.