"The Only EURUSD Strategy You Need" Earns 0.52 Pips a Trade and Pays 1.21
A popular TradingView script trades EURUSD at the New York stock market open: a buy stop at the last swing high, a sell stop at the last swing low, a 2:1 target. We measured it on 2019 to 2021 one-minute data, 664 trades. It made +0.524 pip per trade before costs. Spread and commission cost 1.21 pip. In 2021 it lost money even before costs.
Does "The Only EURUSD Trading Strategy You Need" (Kaspricci) work after costs?
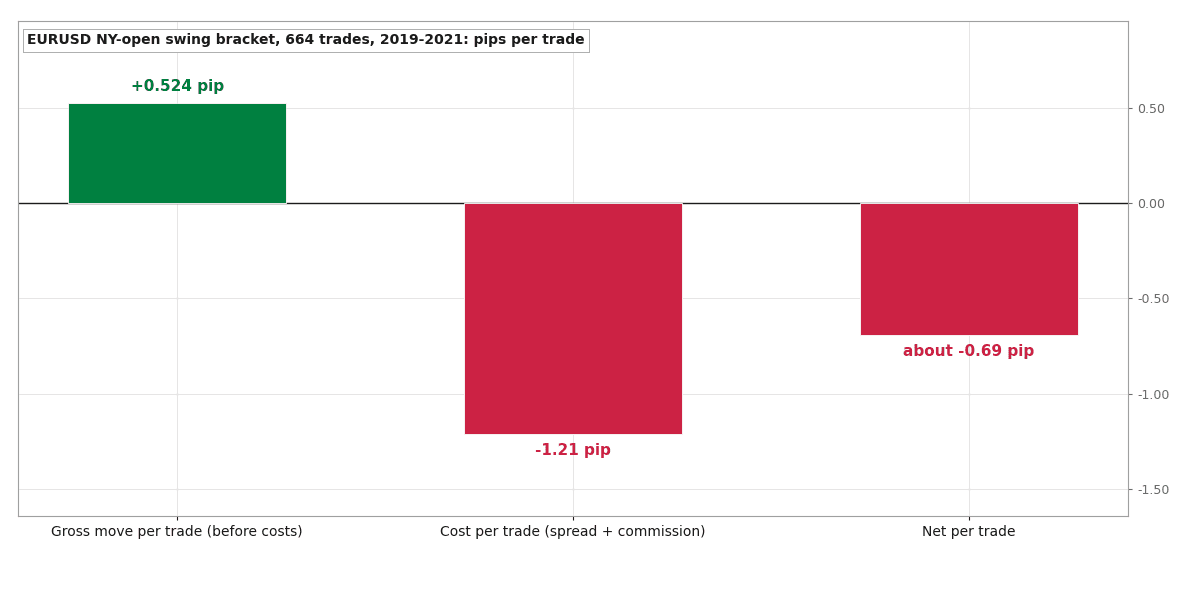
No. On EURUSD from 2019 to 2021, the New York open swing bracket made +0.524 pip per trade before costs, over 664 trades. Spread and commission cost 1.21 pip per trade, so it lost about 0.69 pip a trade. In 2021 it lost 0.805 pip per trade before any costs.
The script
On TradingView there is an open-source strategy with a bold name: "The Only EURUSD Trading Strategy You Need - Kaspricci", published by Best-Algo-Trader in November 2022. Its description says the idea comes from a YouTube video by "Trade Beta", tested on the 5-minute chart. We could not find that video.
The plan is to catch the early move in EURUSD when the New York Stock Exchange opens, at 9:30 in New York:
- Wait for the first 5-minute candle of the session to close.
- Put a buy stop at the most recent swing high and a sell stop at the most recent swing low. A swing high is a candle whose high is above the 5 candles on each side of it.
- When one order fills, cancel the other.
- If price is already above the swing high at the open, place only a sell stop at that level. If it is already below the swing low, place only a buy stop there.
- Stop loss at 2 times the 14-bar ATR (the average candle range). Take profit at 2 times the stop.
- Everything closes at the end of the stock market session.
The page shows no backtest numbers and no commission. So we measured the move ourselves.
How we measured it
We did not build a trading robot for this. The rules are simple enough to check straight from the price data, and if the move isn't there, there is nothing to automate.
- Market and data: EURUSD one-minute bars from Dukascopy, built into 5-minute candles.
- Period: 2019 to 2021, the years we use to build and judge ideas. Our newer, held-back years stay untouched.
- Clock: 9:30 New York time all year. That is 13:30 UTC in US summer time and 14:30 UTC in winter.
- Exit: flat at 15:55 New York time, 5 minutes before the close.
- One trade a day. The script says nothing about re-entering after a stop or a target, so we didn't.
- Fills: orders, stops and targets are checked on one-minute bars. If a bar jumps through an order level, the order fills at that bar's open, not at the level.
Over the three years that gave 664 trades. On 115 days neither order filled before the close.
What came out
Before any costs, the average trade made +0.524 pip. The win rate was 37.8%. Of the 664 trades, 182 hit the target, 380 hit the stop and 102 were closed at the end of the session.
So there is a small positive move. The question is whether it pays the bills.
A round trip on EURUSD costs:
- Spread: 0.51 pip on average, measured at the real entry and exit minutes.
- Commission: 0.70 pip ($3.50 per side per lot, IC Markets Raw rates).
- Overnight swap: none, because every trade closes the same day.
That is 1.21 pip per trade. The edge is 0.524. After costs, each trade loses about 0.69 pip.
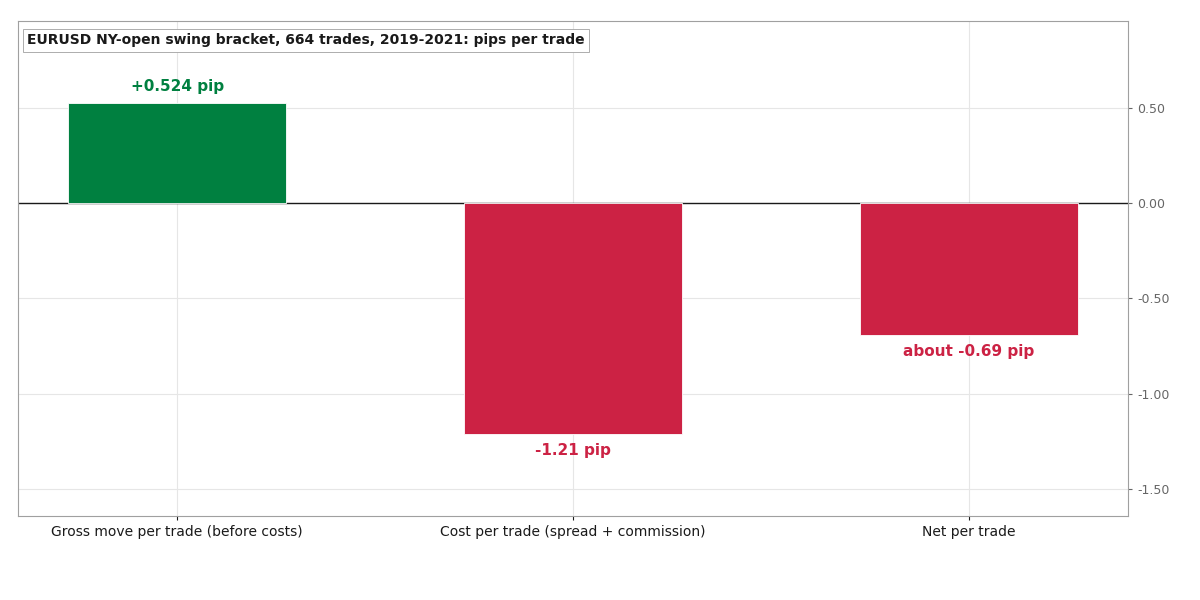 Pips per trade over 664 trades, 2019 to 2021. The move before costs is less than half of what spread and commission take.
To clear costs with a safe margin we look for about three times the cost, roughly 3.6 pips per trade. This setup makes less than half of one times the cost.
The exact rules of every strategy we've put on trial, how we tested each one, and what the data showed. 12 case files so far, free with your email.
The year it turned
Split by year, the picture gets worse.
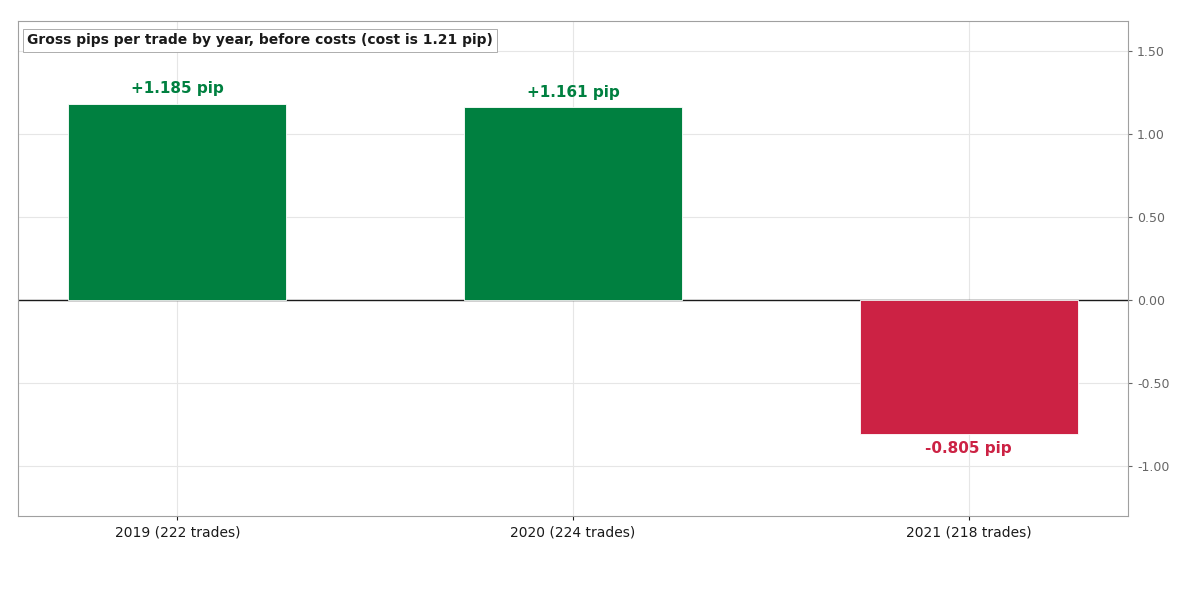 Pips per trade before costs, by year. Even the best year stays under the 1.21 pip cost, and 2021 is negative before any costs.
- 2019: +1.185 pip per trade, 222 trades
- 2020: +1.161 pip per trade, 224 trades
- 2021: -0.805 pip per trade, 218 trades
The two good years both come in under the 1.21 pip cost. Then in 2021 the trades lost money before the broker took a cent.
We tried to save it
A small, unstable result like this invites the obvious question: maybe the default settings are just a bit off. So we moved each setting up and down:
| Change | Pips per trade before costs | 2021 |
|---|---|---|
| Default (5-bar swing, 2x ATR stop, 2:1 target) | +0.524 | -0.805 |
| Swing of 3 bars | +0.527 | -0.295 |
| Swing of 7 bars | +0.803 | -0.906 |
| Swing of 10 bars | +0.778 | -1.175 |
| Stop at 1x ATR | -0.10 | +0.21 |
| Stop at 3x ATR | +1.214 | -0.981 |
| Target at 1x the stop | +0.392 | -0.626 |
| Target at 3x the stop | +1.076 | -0.487 |
None of them clears the cost. Every version is negative in 2021, except the tight 1x ATR stop, which loses over the three years as a whole. There is no nearby setting that works and was just missed.
The clock question
The description says the open is at "13:30 GMT". That is only true in US summer time. In winter the New York open is at 14:30 GMT. We don't know which clock the script's code uses, so we ran both.
With a fixed 13:30 UTC all year, the result is -0.12 pip per trade before costs, over 676 trades. In the winter months it averages -1.246 pip a trade. The New York clock we used above is the better case, and it still loses after costs. So the verdict doesn't depend on that question.
A second count
We had the numbers produced a second time, by separate code written to attack the first result. On the same bid prices it matched exactly: 664 trades, +0.524 pip. It then ran the stricter version where buys trigger and fill on the ask price, which includes the real spread minute by minute. That gave 668 trades and +0.225 pip after spread, which is -0.475 pip per trade after commission. The stricter route lands in the same place.
One cost we did not include is slippage on the stop orders. It could only make these numbers worse.
Verdict
Rejected before we built a robot. The NY open swing bracket on EURUSD does move in the breakout direction a little, about half a pip per trade before costs, in 2019 and 2020. That is not enough to pay a 1.21 pip round trip, and in 2021 the move went the other way.
This fits what we keep finding on intraday breakout ideas. Our failed breakout fade on GBP/USD bet the other way at the London open and also lost to costs. Short-term moves around session opens are small, and the spread is not.
If you trade a setup like this, write down the move per trade before costs and put it next to your spread plus commission. If the first number isn't several times the second, the strategy is working for your broker.
Which strategy should we test next?
The exact rules of every strategy we've put on trial, how we tested each one, and what the data showed. 12 case files so far, free with your email.
Run the numbers yourself
The free calculators behind the sizing and robustness checks in this test. No signup.