A 2024 Paper Says the Tokyo Fix Dollar Bid Comes Every Day. On USD/JPY, 2019-2021, It Came on Gotobi Days.
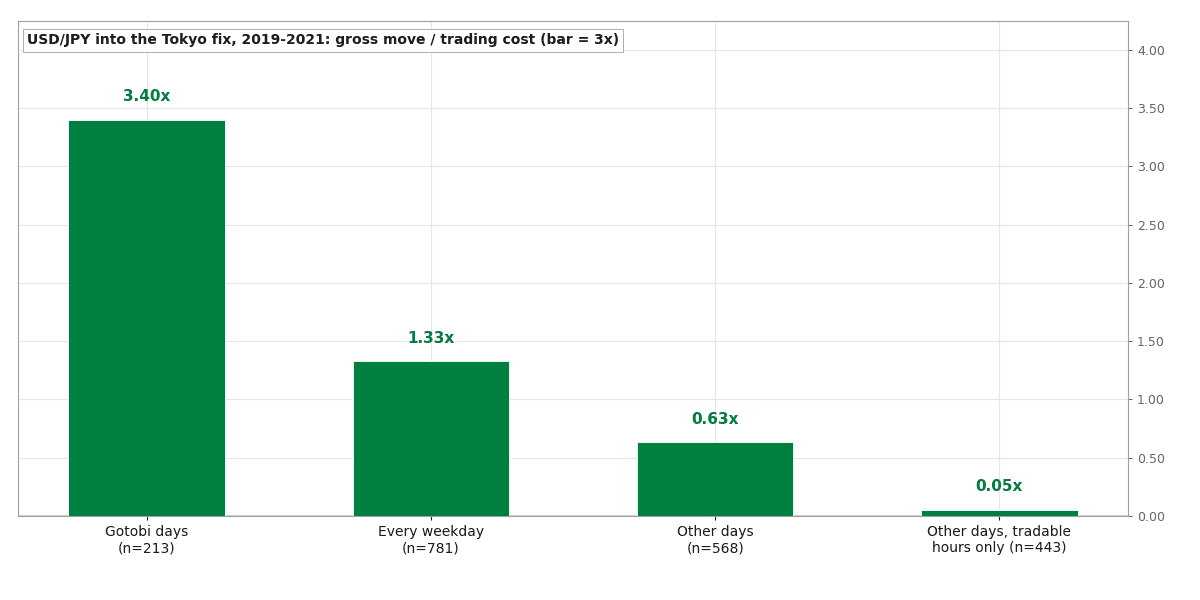
A 2024 Journal of Finance paper says there is demand for dollars before the 9:55 Tokyo fix every day, not only on gotobi days. If that were true, our gotobi strategy was skipping most of its possible trades. We measured it on USD/JPY one-minute data, 2019 to 2021, before writing any code. On gotobi days the move into the fix paid 3.40 times its trading costs. On the other days it paid 0.63 times. In hours a trader can actually trade, the other days moved 0.05 times their costs. The day filter is doing the work.
Does the dollar move into the Tokyo fix happen every day, or only on gotobi days?
Only on gotobi days. On USD/JPY, 2019 to 2021, the move into the 9:55 Tokyo fix paid 3.40 times its trading costs on gotobi days and 0.63 times on the other days. In hours a trader can actually trade, the other days moved 0.05 times their costs.
The Backtest Files: the exact rules of each strategy we've put on trial, how we tested it and what the data showed. Free with your email.
Two papers, one fix, two stories
Every weekday at 9:55 Tokyo time (00:55 UTC), Japanese banks set the official daily dollar-yen exchange rate. This is the Tokyo fix. Two serious pieces of research say the dollar tends to rise in the hours before it. They disagree about when.
- Ito and Yamada (NBER working paper 22820) tie the rise to gotobi days, the dates that divide by five (the 5th, 10th, 15th and so on). Japanese importers settle their dollar bills on those dates, so their banks buy dollars before the fix.
- Krohn, Mueller and Whelan (Journal of Finance, 2024) find the dollar rising into the Tokyo, Frankfurt and London fixes and falling back after. They call it an "unconditional demand for U.S. dollars at currency fixings", and they write that it is "not driven by day of the week or month of the year effects".
This matters to us because our own gotobi strategy only trades on gotobi days, about 72 days a year. If the second paper is right and the dollar bid is there every day, that filter was throwing away most of the possible trades.
So we checked, before writing a single line of strategy code.
What we measured
We kept everything from the gotobi strategy and changed one thing: the day.
- Market: USD/JPY, Dukascopy one-minute data.
- Period: fixes from 1 January 2019 to 31 December 2021. This is our in-sample data, the years we use to check ideas. We read nothing from 2022 onwards.
- The trade: buy nine hours before the fix and sell at the fix. Same 60-pip stop and 200-pip target as the gotobi strategy.
- Costs: the real spread at the time of each entry, plus $7 of commission per lot for the round trip.
- The bar, set before we looked: the move on non-gotobi days had to be at least 3 times its costs, and positive in at least 2 of the 3 years.
Then we split the days into three groups: gotobi days, every other day, and all weekdays together. For each group we compared the average price move into the fix (before costs) with the average cost of the trade.
We ran this twice, with two separate scripts that share no code. The second one skips the stop and target and just measures the price from entry to fix. The two agree closely. We quote the second one below and give the first in brackets.
As a check that the setup was right, the first script found exactly 213 gotobi trades in these three years, the same count our gotobi backtest found.
The result: the extra days don't pay
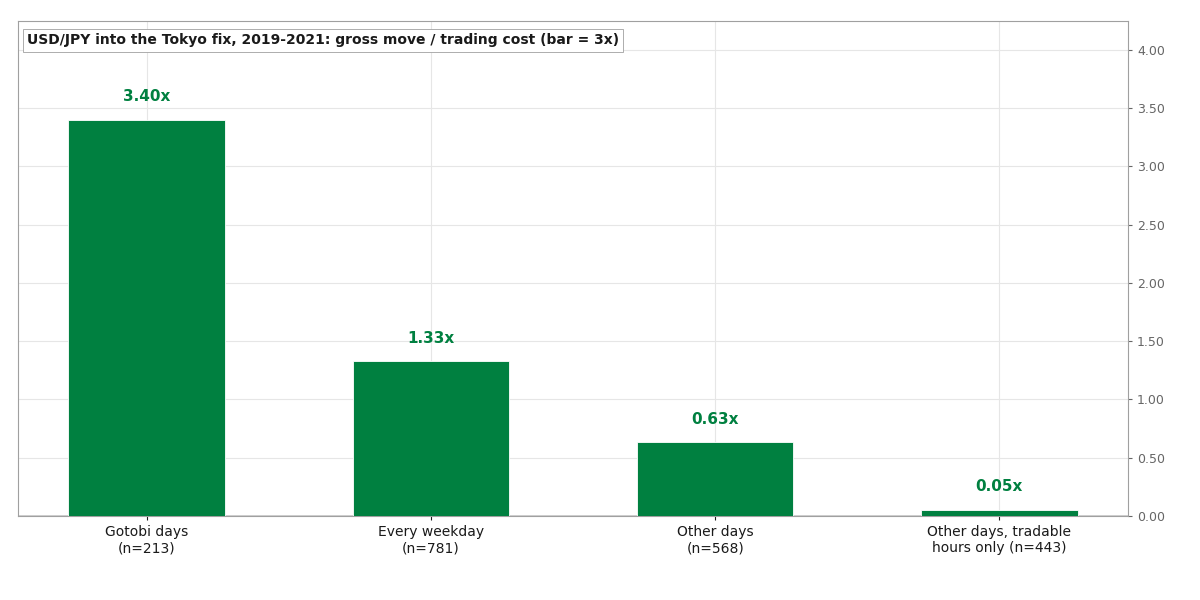 USD/JPY into the Tokyo fix, 2019 to 2021: gross move divided by trading cost, by type of day. The bar we set was 3x.
| Days | Trades | Move per lot | Cost per lot | Move / cost |
|---|---|---|---|---|
| Gotobi days | 213 | $48.58 | $14.29 | 3.40x (3.82x) |
| All weekdays | 781 | $20.58 | $15.52 | 1.33x (1.47x) |
| Other days | 568 | $10.08 | $15.97 | 0.63x (0.65x) |
On gotobi days the dollar moved more than three times what the trade cost. On the other days it moved less than the cost. Adding those days to the strategy would not add a second edge. It would dilute the first one, from 3.40x down to 1.33x, while more than tripling the number of trades.
The gap between the two day types is very unlikely to be luck. The difference per trade has a t-statistic of 2.77, and its 95% confidence interval (the range where the true value very likely sits) is fully above zero.
The other days were also inconsistent. After costs they made money in only 1 of the 3 years in the second script (2 of 3 in the first). The bar asked for 2.
Most of what was left lived in hours you can't trade
There is one more detail, and it turned out to be the biggest one.
Our data shows USD/JPY prices from about 21:00 UTC on Sunday. But the broker does not take trades until Monday 00:00. A trade that "enters" in those Sunday hours exists in the data and not in a real account.
For a Monday fix, nine hours earlier is still Sunday. So 125 of the 568 non-gotobi entries fell in hours a real account could not trade. When we took them out:
- Other days, tradable hours only (443 trades): the move was $0.60 per lot against $11.10 of cost. That is 0.05x. Not small. About zero.
- Gotobi days, tradable hours only (182 trades): 4.33x. The gotobi effect gets stronger when you remove the untradable entries.
Almost all of the small move we had seen on non-gotobi days sat in hours nobody could have traded.
One more thing in the table needs explaining. After costs, the 568 trades on other days still averaged +$5.24 a lot. The price move of $10.08 did not cover the $15.97 cost, so that profit did not come from the price. It came from the overnight interest (swap) a long USD/JPY position earned in those years.
Maybe nine hours was the wrong window
This is the strongest objection, so we tested it. Nine hours came from our gotobi strategy. The 2024 paper looks at a shorter window, about four hours before the fix. If dealers buy close to the fix, a nine-hour trade would bury their buying under five hours of noise.
So we moved the entry from 1 hour to 12 hours before the fix and measured the non-gotobi days again, tradable hours only.
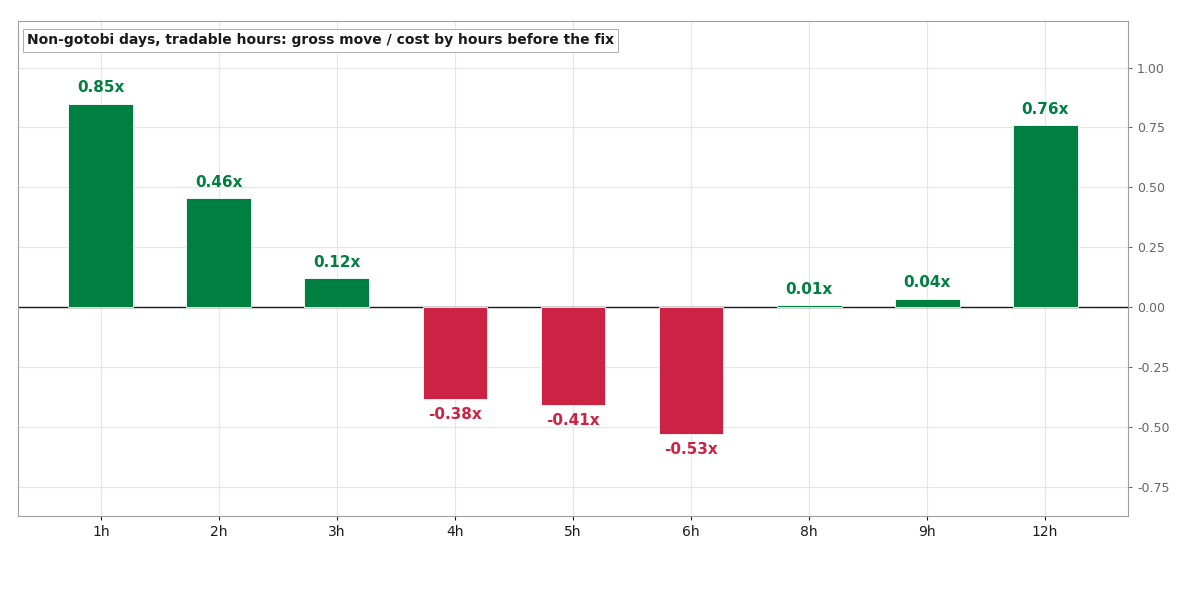 Non-gotobi days, tradable hours only: gross move divided by cost, by how many hours before the fix the trade enters.
- The best entry time was 1 hour before the fix, at 0.85x the cost. The bar was 3x.
- At 4 hours, the paper's own width, the move went the wrong way: -0.38x.
- We also split the other days by weekday and by month end. The best group was Tuesday at 1.32x. None reached 3x.
With nine entry times tested, one of them looking a bit better is what chance alone would give. The 1-hour result does not reach the stricter bar you need when you test that many.
The same test showed something about the gotobi days. Their move grows the longer you hold. With the Sunday entries removed, it was 3.00x at 6 hours, 4.33x at 9 hours and 6.39x at 12 hours. The other days stay below their costs at every length. Dealers hedging just before the fix would leave a move close to the fix. Importers' banks buying through the night would leave a move that builds over many hours. The data looks like the second one, and only on gotobi days.
What this means
On USD/JPY, in 2019 to 2021, with retail costs, the dollar bid into the Tokyo fix is a gotobi-day effect. The every-day version of the claim does not show up in our data at a level anyone could trade.
That does not make the 2024 paper wrong. It covers 1999 to 2019, many currencies and three fixes. We tested one pair, one fix and three years, with a spread and commission on every trade. At that size the extra days are not worth trading.
It does settle a question about our own strategy. The gotobi filter was something we took from the first paper and never tested. Now it is tested, and it holds.
The limits of this test
- Three years, one currency pair, one fix. We did not test the Frankfurt or London fixes from the same paper.
- We did not test 2022 onwards. The idea failed on the 2019 to 2021 data, so we did not build a robot or use the later years.
- Our costs are a retail ECN account: the real spread plus $7 per lot. A bank with much lower costs could see this differently.
Which strategy should we test next? Tell us in the comments on our videos, or send it through the contact page.
The exact rules of every strategy we've put on trial, how we tested each one, and what the data showed. 27 case files so far, free with your email.
Send us your rules or your MT5 EA. We run them through the same tests as this post, with real broker costs and data the strategy has never seen, and give you a plain verdict.
Run the numbers yourself
The free calculators behind the sizing and robustness checks in this test. No signup.