A Paper Says Big FX Weekend Gaps Reverse. They Did, Mostly in 2020.
A 2016 study found that extreme weekend gaps in spot FX reverse over the following week. We traded it on five USD pairs from 2018 to 2021 with full costs. The effect is there, +52.5 bps a trade after costs, but one year carried it and the last year lost.
Do extreme forex weekend gaps reverse during the following week?
In our 2018 to 2021 test, on average, yes. Fading the biggest 5% of weekend gaps on EURUSD, GBPUSD, USDJPY, AUDUSD and USDCAD made +52.5 bps a trade after spread, commission and swap, over 87 trades. But 2020 supplied 42 of those trades and +100.4 bps a trade, 2021 lost -15.4 bps a trade, and no group of settings held up. We rejected it and did not run it on 2022 to 2026 data.
The Backtest Files: the exact rules of each strategy we've put on trial, how we tested it and what the data showed. Free with your email.
The claim
In 2016 three researchers, Dao, McGroarty and Urquhart, published "A calendar effect: Weekend overreaction (and subsequent reversal) in spot FX rates" in the Journal of Multinational Financial Management. Their finding: when a currency pair opens on Monday far away from where it closed on Friday, it tends to come back during the week. The paper looked at 16 pairs on daily data from 2002 to 2014, and in its own words "only one shows no significant reversal". It reports returns "net of costs" of "up to more than 10% per annum" for a simple contrarian rule.
The story behind it makes sense. News lands on the weekend while the interbank market is shut. When trading starts again, people overreact to it, and over the next few days part of that jump is given back.
We already tested a cousin of this idea. In the weekend gap fade the target was the gap filling on Monday itself, and most gaps filled on Sunday night, in hours a normal MT5 broker shows prices but does not let you trade. This paper is about something slower. It doesn't care about the fill. It says the reversal builds over days.
What we tested
We turned the paper's rule into a strategy and ran it on five USD pairs we have clean data for: EURUSD, GBPUSD, USDJPY, AUDUSD and USDCAD.
- The gap: the move from Friday's last price to the first price you can actually trade on Monday (00:00 UTC). Sunday night quotes are ignored.
- "Extreme": the gap is in the top or bottom 5% of that pair's own past weekend gaps, the paper's headline number. Only past weekends count, with at least two years of history, so the rule never peeks ahead.
- The trade: at 00:05 UTC on Monday, go against the gap. Gap up, sell. Gap down, buy.
- The exit: Friday at 20:55 UTC, so the trade is always flat before the next weekend. A wide safety stop of 3 times the average daily range sits under every trade (the paper has none; a stop can only make results worse than theirs).
- Costs: real spread, $3.50 per side per lot commission and the overnight swap for every night held, including the triple swap on Wednesday.
- Data: 2017 to 2021. The two-year warm-up means the first trades come in early 2018. We kept 2022 to 2026 back as untouched test data.
Before we wrote any code, we measured the raw move. At the headline setting the average fade made +58.3 bps a trade before costs (a basis point is one hundredth of a percent), against a cost of about 3.07 bps. That is 19x the cost. Plenty of ideas fail this first check. This one passed it easily.
What came out
The full test confirmed the measurement. Across the five pairs the headline setting made 87 trades and +$754.24 net, an average of +52.5 bps a trade after all costs.
| Pair | Trades | Net profit | Profit factor | Net per trade |
|---|---|---|---|---|
| EURUSD | 9 | +$40.60 | 1.21 | +43.3 bps |
| GBPUSD | 14 | +$509.79 | 5.52 | +119.0 bps |
| USDJPY | 8 | +$146.50 | 2.09 | +108.6 bps |
| AUDUSD | 32 | +$29.56 | 1.05 | +37.5 bps |
| USDCAD | 24 | +$27.79 | 1.05 | +18.4 bps |
Every pair made money. So far this looks like one of the rare ones. Two things say otherwise.
Problem one: it was mostly 2020
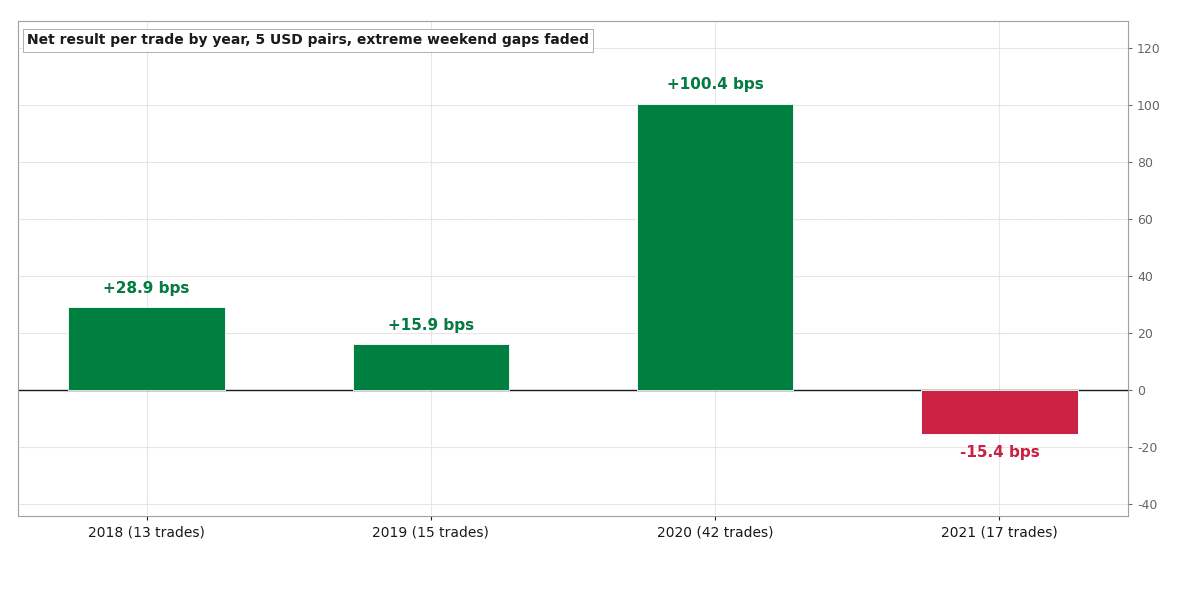
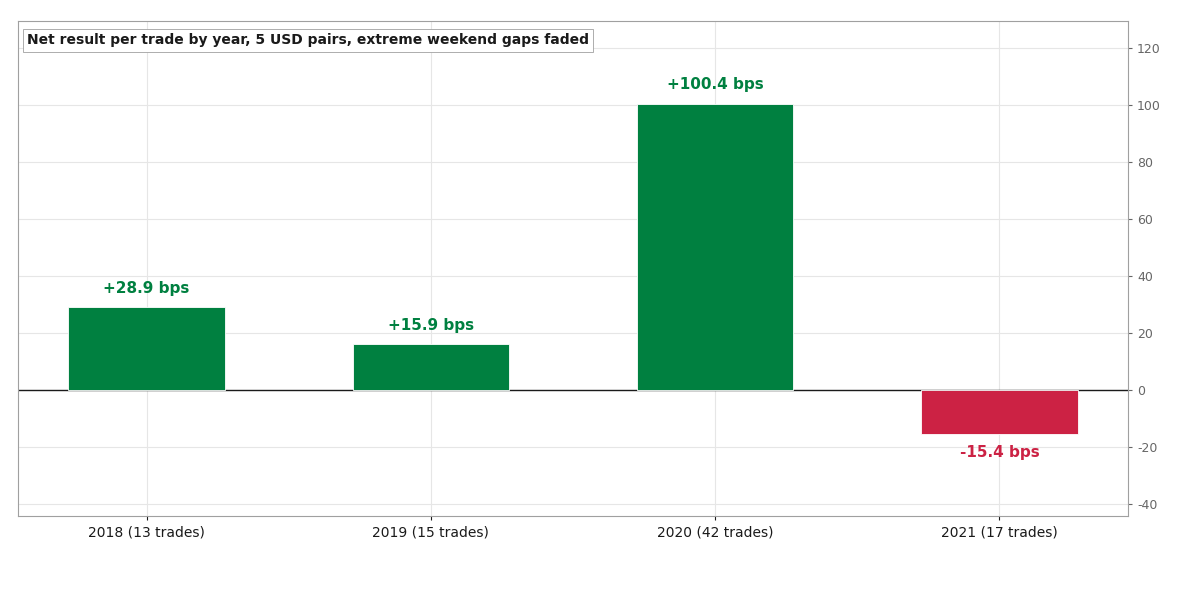 Net result per trade by year at the headline setting
Split the same 87 trades by year:
- 2018: 13 trades, +28.9 bps a trade
- 2019: 15 trades, +15.9 bps a trade
- 2020: 42 trades, +100.4 bps a trade
- 2021: 17 trades, -15.4 bps a trade
2020 was the Covid year. Markets gapped hard and often, and those gaps did reverse. That one year gave 42 of the 87 trades and most of the profit. Before costs, the other three years together averaged +13.4 bps a trade over 45 trades. And the last year of the test, 2021, lost money.
The trades also bunch together. The 87 trades fell on only 50 different weekends, because weekend news about the dollar tends to hit all five pairs at once. So this is less like 87 separate bets and more like 50.
The plan we wrote before running anything said: reject it if the result flips sign from year to year. 2021 flipped it.
Problem two: no setting holds up
The obvious fix is to trade more gaps, so the result rests on more than one year. We tested every combination of three gap sizes (top 5%, 10% and 15%), five holding periods (1 to 5 days) and three stop sizes. That is 45 settings on each of the five pairs.
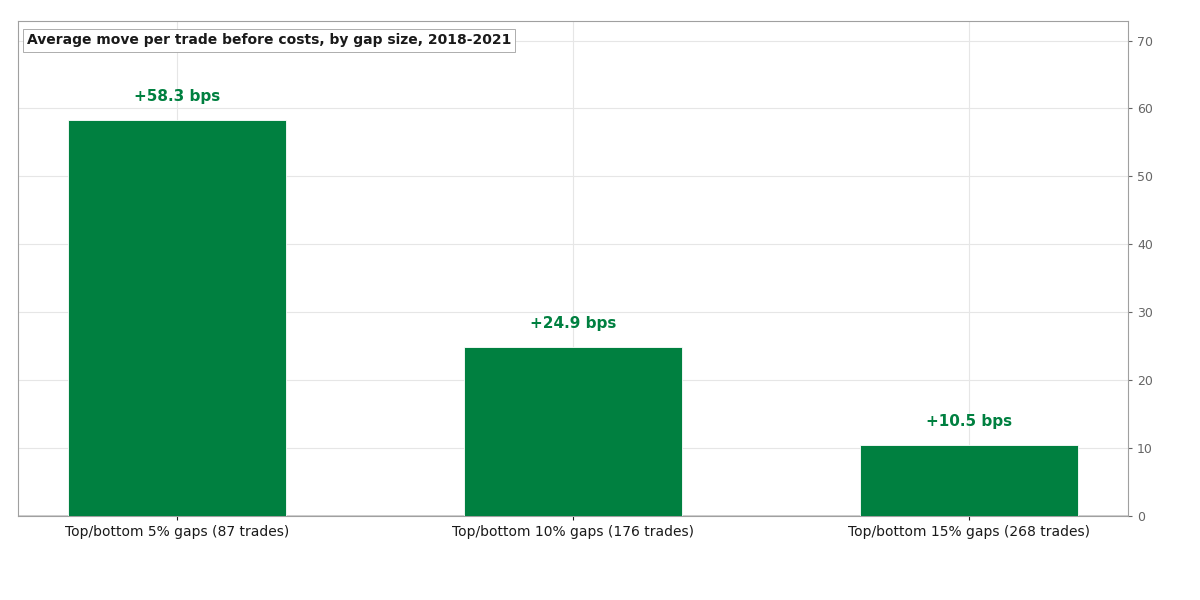 Average move per trade before costs, by gap size
Taking more gaps brings more trades, but the edge thins out fast: from +58.3 bps a trade at the top 5% to +24.9 at 10% and +10.5 at 15% (before costs). Holding for one day only, the setting closest to the old Monday gap fade, lost -2.9 bps a trade before costs. Whatever reversal there is takes the whole week.
We only trust a setting if the settings around it also work. A good result that falls apart when you nudge one number is usually luck. Only one setting had enough trades (150 or more) and made money on at least four of the five pairs: the top 10% of gaps, held 5 days, 176 trades. Its 17 neighbours reached 0.651 of its strength on average, and 0.647 of them were profitable. Our bar is 0.70 on both. Of the 45 settings, none formed a stable group.
So we rejected it.
What we did not do
We never ran this on 2022 to 2026. That data stays untouched until a setting passes on the earlier years, and none did. Running it anyway, just to see, would turn the held-back years into one more round of tuning. For the same reason there is no Monte Carlo test and no buy-and-hold comparison here: both are run on a setting that made it to the held-back years.
That means everything above is 2018 to 2021 only. It is real evidence that the reversal existed in that window, mostly in one wild year. It is not evidence that it works today.
The lesson
One great year can look like an edge. A strategy that averages +52.5 bps a trade after costs, makes money on all five pairs and beats its costs 19 times over sounds like a finished product. Split it by year and you find one year doing the work and the latest year losing. Always split by year before you believe an average.
The paper's effect is probably real. The weekend overreaction showed up in our data too. But "real" and "tradeable on its own" are different things, and 87 trades on 50 weekends, almost half of them in 2020, is not enough to tell the two apart.
Which strategy should we test next? You can see every strategy we tested, winners and losers, on the results page.
Past performance does not mean future results. These are backtests with real trading costs. They are not live trading results.
The exact rules of every strategy we've put on trial, how we tested each one, and what the data showed. 12 case files so far, free with your email.
Send us your rules or your MT5 EA. We run them through the same tests as this post, with real broker costs and data the strategy has never seen, and give you a plain verdict.
Run the numbers yourself
The free calculators behind the sizing and robustness checks in this test. No signup.