A Paper's Bitcoin Trade Won 91% of the Time. In Real Time It Won 41%.
A 2020 paper says riding Bitcoin's most extreme days wins 86% to 91% of the time. We tested it with a trigger you could really trade. The average trade lost 29.98 basis points before costs, and all 9 settings were negative.
Does trading Bitcoin's abnormal days work?
Not in our test. A 2020 paper reports 86% to 91% winners from riding Bitcoin's extreme days to the close, with no costs. We entered the moment a day crossed the paper's line, which is what a real trader has to do. Over 205 trades from 2017 to 2021, the average trade lost 29.98 basis points (0.2998%) before costs, and all 9 settings we tried were negative before costs. We rejected it.
The Backtest Files: the exact rules of each strategy we've put on trial, how we tested it and what the data showed. Free with your email.
The claim
Bitcoin has days that are nothing like normal days. A 2020 paper by Caporale and Plastun, published in Financial Markets and Portfolio Management, asks what happens on those days. It looks at Bitcoin from January 2015 to September 2019 and calls a day "abnormal" when its move from open to close is more than 2 standard deviations away from the recent average.
The paper's first strategy is simple. When it becomes clear the day is abnormal, trade in the same direction and close at the end of the day. Its Bitcoin results, with no trading costs, look like this:
| Strategy 1 | Trades | Winners | Average trade |
|---|---|---|---|
| After a big up move | 49 | 86% | +2.92% |
| After a big down move | 46 | 91% | +4.40% |
A win rate of 91% on Bitcoin is worth checking.
The paper also has a second strategy, which trades the morning after an abnormal day. For Bitcoin, that means selling short after both kinds of day. It reports 59% and 54% winners, at +1.54% and +1.13% a trade, and the paper's own tests do not call either result statistically significant.
The problem with 91%
As far as the paper's text shows, the first strategy enters at the average time an abnormal day gets detected, on days already known from the full-day close to be abnormal. So it only ever trades days that finished extreme.
Nobody can do that live. At 2pm you know the day has moved a lot. You don't know if it will end that way. Some days cross the line and then come all the way back, and a real trader takes those trades too.
So we changed one thing. We used the same line, but we entered the first time the day's running move crossed it.
What we tested
- Market and data: BTC/USD, one-minute data, May 2017 to the end of 2021. That overlaps the paper's own period, so this is a fair place for the idea to work. The years from 2022 on stayed untouched.
- The line: the average daily move plus or minus 2 standard deviations (K 2.0) over the last 30 complete days. The paper's averaging period didn't survive in the text we could read, so we also ran 60 and 90 days, with K at 1.5, 2.0 and 2.5.
- Ride the day (Strategy 1): on the first closed 15-minute bar past the line, enter in that direction at the next bar. Exit at 23:55 UTC.
- The next morning (Strategy 2): sell at 00:00 UTC. Exit at 16:00 after a big up day, or at 11:00 after a big down day.
- Stop: one average daily range. The paper has no stop, so we measured with and without it. The stop is part of our rules, so the "with stop" number decides.
- Costs: $5 spread plus $7 commission per trade, which is today's quote, plus a small swap on longs held past the rollover. That averages 14.07 basis points a trade. With a $25 spread as a stress test, it averages 35.11.
We show results in basis points. One basis point is 0.01%, so the paper's +4.40% would be 440 basis points.
What came out
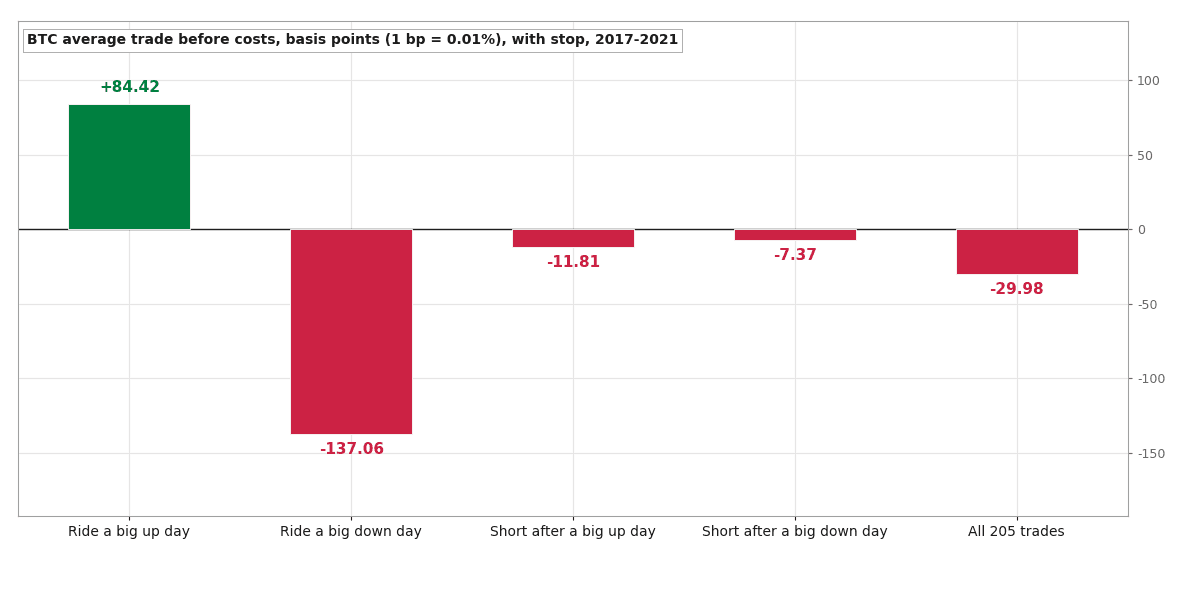
 Average trade before costs by leg, 2017 to 2021. Only riding the big up days is positive.
| Before costs, with stop | Trades | Winners | Average trade | Cost |
|---|---|---|---|---|
| All trades | 205 | 47% | -29.98 | 14.07 |
| Ride a big up day | 56 | 57% | +84.42 | 19.03 |
| Ride a big down day | 74 | 41% | -137.06 | 12.42 |
| Short after a big up day | 40 | 48% | -11.81 | 12.62 |
| Short after a big down day | 35 | 43% | -7.37 | 11.26 |
The strategy loses before you pay anything. The average trade is -29.98 basis points, and costs would take a further 14.07. Without the stop it is worse, at -43.87.
The 91% trade became a 41% trade. Riding the big down days is where most of the damage happens: the day crosses the lower line, we sell, and the day recovers.
The second strategy, the part of the paper with no hindsight problem, was also negative in both cases. The paper already said it wasn't significant.
The years don't help either:
| Year | Trades | Average trade before costs |
|---|---|---|
| 2017 | 24 | -93.14 |
| 2018 | 42 | +30.83 |
| 2019 | 30 | +2.73 |
| 2020 | 45 | -37.75 |
| 2021 | 64 | -56.07 |
2018 is the only year that clears its cost of 21.13. 2019 made +2.73 against a cost of 19.28.
We tried the other settings
Perhaps the default was just a bad choice. So we ran every setting in the plan.
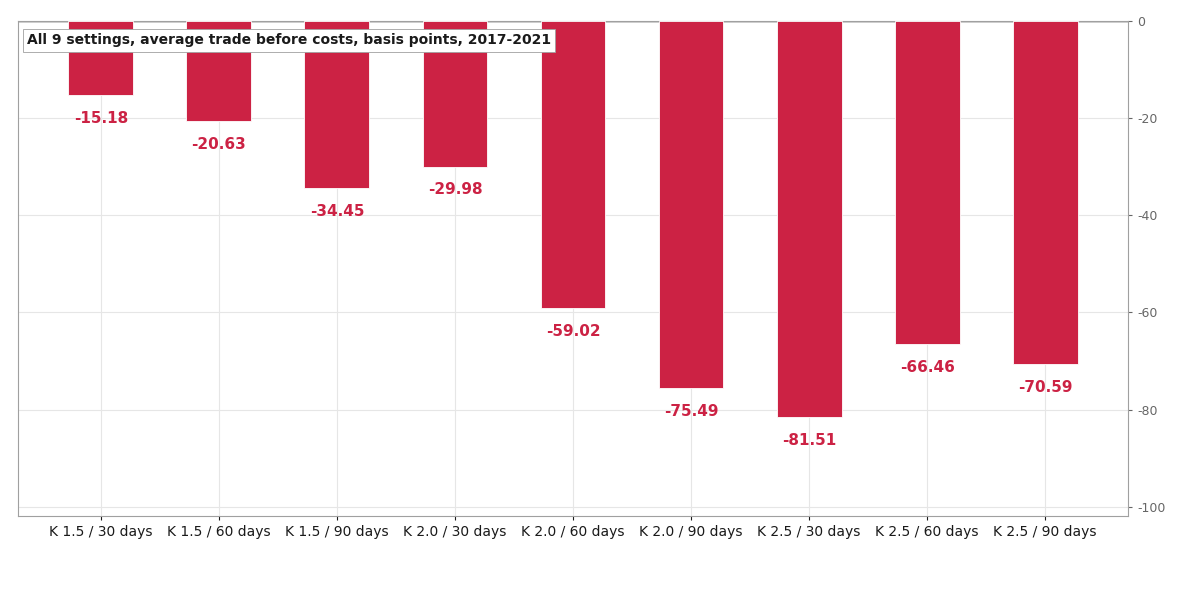 All 9 settings are negative before costs.
All 9 are negative before costs. The best is -15.18 basis points on 413 trades, and the worst is -81.51 on 112. Taken alone, the morning-after trades are positive in only 2 of the 9 settings (+7.65 and +1.85), and both are below cost.
The one bar that looks good
Riding the big up days made +84.42 basis points, against a cost of 19.03. We are not going to call that an edge, and here is why:
- It is one leg of four, and we'd be picking it after seeing the result.
- The sample is a Bitcoin bull market, and we didn't compare it with simply being long at those times.
It's on the chart, and it isn't a verdict.
The verdict
Rejected at the measurement stage, before any trading code was written. Two separate runs of the numbers agree on 205 trades and on the -29.98. Filling at the previous close instead changes it only to -31.52.
The paper's win rates may be right for what it measured. They don't describe a trade you could place. If a backtest only trades days that are already known to be extreme, the win rate tells you about those days and nothing about the decision you face at 2pm.
Before you trust a high win rate, ask when the strategy knew it should trade.
Limits of this test: the paper doesn't state the clock for its exit times, so we read them as UTC. Our data has no weekend bars before 2020, so 9 next-day trades at the default setting were dropped. Costs use today's quote for every year, but with the average trade negative before costs, that can't change the result.
These are measurements on past data. They are not live trading results. This is not financial advice.
The exact rules of every strategy we've put on trial, how we tested each one, and what the data showed. 27 case files so far, free with your email.
Send us your rules or your MT5 EA. We run them through the same tests as this post, with real broker costs and data the strategy has never seen, and give you a plain verdict.
Run the numbers yourself
The free calculators behind the sizing and robustness checks in this test. No signup.