The London Fix Reversal: a Real Anomaly That Pays Less Than a Savings Account
We tested the WM/R 4pm fix reversal on 7 years of GBPUSD tick data. It passed 11 of our 12 tests, and we still said no. The one test it failed is the one that matters most.
Does the London 4pm fix reversal still work?
Yes, it is real, but it pays very little. On GBP/USD it passed 11 of our 12 tests on new data (profit factor 1.225, largest drop 2.2%). But it kept only 39% of the return it made in the first test. That is about 0.7% a year.
Most strategies we reject are simple cases. There was never an edge, the backtest shows it, and we move on. This one is different.
The London fix reversal passed eleven of our twelve tests. It kept 88% of its profit factor over four years of new data. It still made money when we doubled the commission. We rejected it anyway. The reason is worth writing down: the effect is real, but it pays only about 0.7% a year (70 basis points, where 1 basis point is 0.01%).
What is the London fix?
Every day at 4pm London time, a benchmark exchange rate is set. It is called the WM/R fix. Many big funds must buy or sell currency at this exact price.
Their orders push the price in the minutes before the fix. After the fix, the price often moves back part of the way. This is the reversal we wanted to trade.
This is not just a trader's story. There is research behind it:
- Evans (2017) showed that the move partly reverses after the fix. The effect is strongest at month-end, when funds rebalance and the orders are biggest.
- The Norges Bank studied the same thing.
- A 2024 replication (a new study that repeated the test) found the effect was still there.
The problem we knew about
The strong results in the papers use data from before 2015. In 2015, after a scandal where banks cheated on the fix, the rules changed. The time window for the fix went from one minute to five minutes. After that, most of the reversal went away.
Our data starts in 2019. So we were not asking "does the famous effect work?". We were asking "is anything left of it?". We expected to reject it. The surprise was how it failed.
The rules we tested
- Measure the price move in the 15 minutes before the 4pm London fix. We converted 16:00 London time to UTC with the correct summer time (DST) rules, which change on the last Sunday of the month.
- If the price fell by at least 15 pips before the fix, buy at the first M5 bar (5-minute candle) at the fix. If it rose by at least 15 pips, sell. We always trade against the push.
- Close the trade 30 minutes after entry, no matter what. Use a fixed 30-pip stop loss (the price where we close a losing trade).
- One trade per fix, at most one per weekday. Each trade risks 0.5% of the account.
Test setup:
- GBPUSD, Dukascopy tick data (every single price change, not just candles).
- Start balance $10,000.
- Commission of $3.50 per side per lot. Swaps (the overnight interest fee) are charged as normal.
- In-sample (the data we use to find the best settings): 2019 to 2022.
- Out-of-sample (new data the strategy has never seen): 2022 to 2026. We ran it exactly once, with the settings frozen. This strategy used one out-of-sample run in total.
First test: the effect shows up everywhere
We changed only three settings: the size of the move, how long to hold, and the stop. That gave 48 combinations. 42 of the 48 made money before costs.
When almost every combination makes money before costs, something real is there. Curve fitting (settings that only fit past luck) gives a few lucky spots, not a result like this.
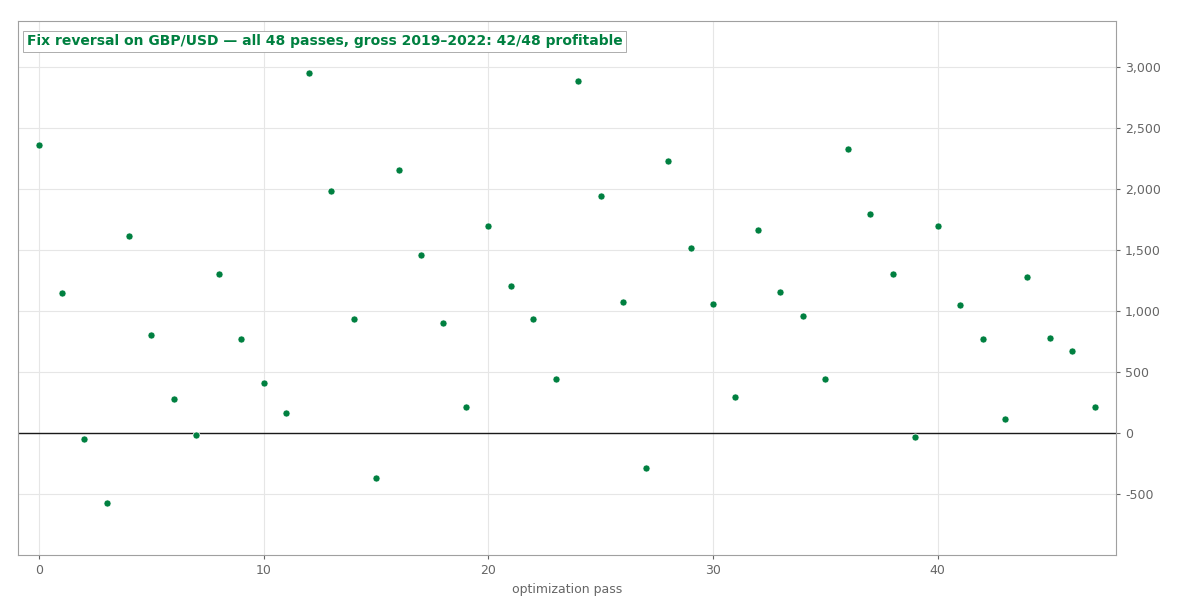 All 48 optimization passes on GBP/USD, gross profit 2019 to 2022. 42 of 48 configurations finished positive.
Then real tick data removed most of them. We picked three groups of good settings. Before freezing anything, we tested each one again on tick-by-tick data. Two of the three failed right away.
Why? Our faster test used M1-OHLC data (only the open, high, low and close of each 1-minute candle). That data made their profit factor look 0.2 to 0.3 too high. The spread (the cost to trade) gets wider exactly at the fix, and it ate the versions that trade small moves.
The one that survived only trades moves of 15 pips or more. These moves are big enough that the spread at the fix does not decide the result.
Case 008 in one PDF: the exact rules, how we tested them, and what we found. Free with your email.
Test on new data: it held, but it did not matter
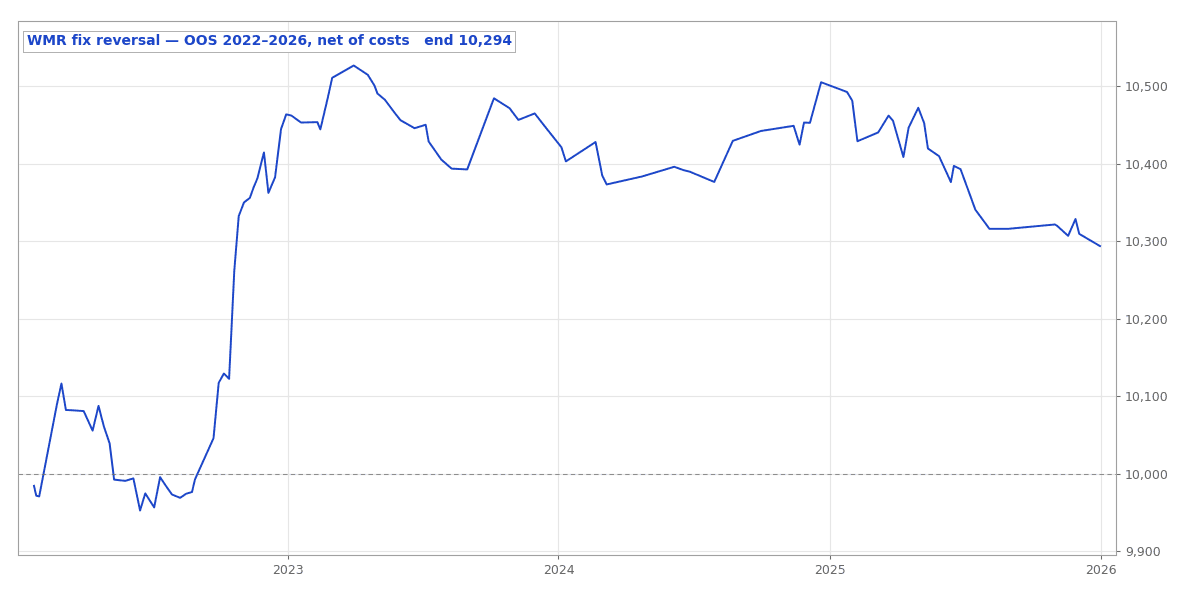
The frozen settings were: trade against 15-pip moves before the fix, hold 30 minutes, 30-pip stop. We ran them once on the out-of-sample years, 2022 to 2026. That gave 142 trades.
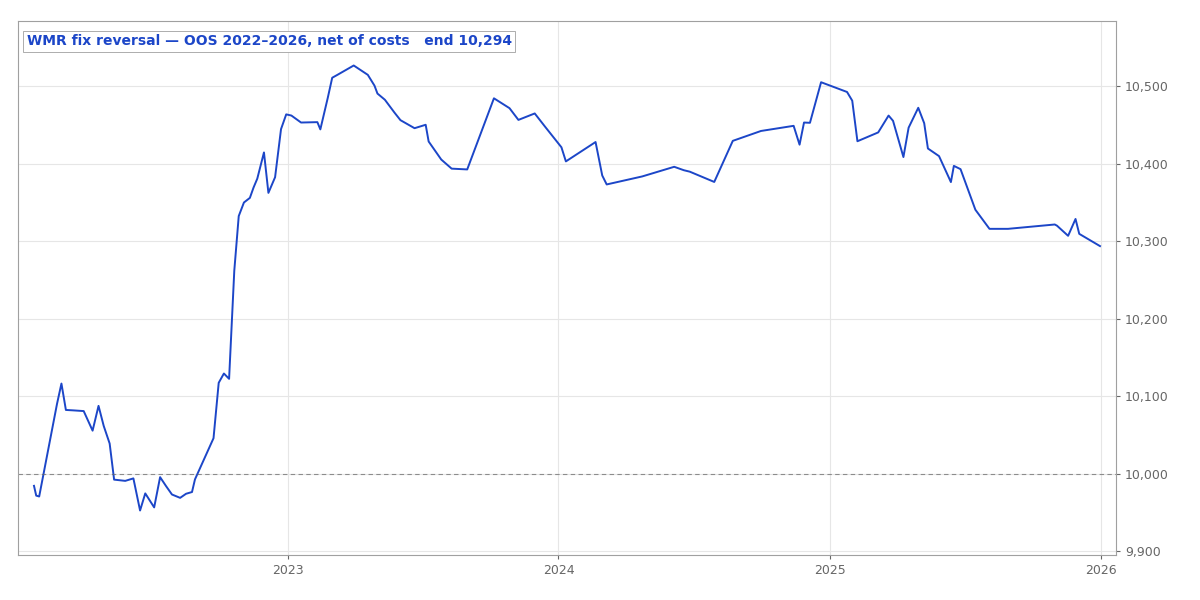 Out-of-sample equity, 2022 to 2026, net of modeled costs. Profitable, shallow, and visibly fading after 2023.
The results:
- Profit factor 1.225 after costs. (Profit factor = total wins divided by total losses. Above 1 means it made money.)
- Max drawdown 2.21%. (Drawdown = the biggest drop from a high point.)
- Profit factor retention 0.88. It kept 88% of its in-sample profit factor. Our minimum is 0.70. This is what a real effect looks like, not luck from tuning.
- We raised the commission from $3.50 to $8.50 a side. It still made money.
Eleven tests, eleven passes.
The twelfth test asks a simpler question: how much money did it keep?
- In-sample, it made about 1.9% a year.
- Out-of-sample, it made about 0.74% a year.
So it kept 0.39 of its return. Our minimum is 0.5. This was the only test it failed. At 0.5% risk per trade, the full four years of new data made $293.55 on a $10,000 account.
Evans said the effect is strongest at month-end. Our data agrees. The 19 month-end trades in the out-of-sample years made $151.25 after costs, with a 58% win rate (the share of trades that made money). That is half the profit from 13% of the trades.
A version that only trades at month-end would be the cleanest way to trade it. But that gives only about a dozen trades a year. It can never reach our minimum number of trades, so it stays a side note, not a strategy.
How much can luck change the result?
Because the effect is real, we ran our full set of checks. We replayed the 142 out-of-sample trades 10,000 times, in random order and with random resampling (picking trades at random, with repeats). This is called a Monte Carlo or bootstrap test.
The profit factor landed between 0.78 and 1.91. There was an 18.8% chance that the whole period loses money. That is honest for an edge this small. It is also exactly why we test how much return a strategy keeps. You can explore the results yourself:
Each run reshuffles the 142 out-of-sample trades, drawing them with replacement, and totals the result. The blue line is what actually happened; the shaded band left of zero is every run that ended in the red.
Did it beat doing nothing special? GBP/USD itself went nowhere in these years. Buy-and-hold had a MAR of -0.004, and 12-1 momentum (a simple trend rule) had -0.032. (MAR = yearly return divided by the biggest drawdown. Higher is better.) So any strategy that made money beats these easily. The strategy's own MAR was 0.334. It is a real, small edge with low risk, on a pair where simply holding gave nothing.
It is not only a GBP/USD effect
Added 2026-08-02. Later we checked every result in our process on related markets. The fix reversal was one of the few that also worked elsewhere. We used the same frozen rules and the same in-sample years on six pairs. We did not change any settings.
- EUR/USD has a smaller version of the same effect: $13.45 per lot after costs across 56 trades. That is about 2.1 times the costs. It made money in two of the three years.
- EUR/JPY gives $8.48, about 1.5 times costs.
- USD/JPY has almost nothing: 0.02 times costs.
- USD/CAD does not work even before costs.
- EUR/GBP only makes money if you trust its spread floor, which our data pads (fills in with an estimate). So we do not count it either way.
These are in-sample measurements, not backtests. We did not write an EA (expert advisor, an automated trading program). We did not touch any out-of-sample data. None of these is a strategy.
What they give us is a check on the cause. The effect shows up on the pairs where fix orders are biggest, the EUR pairs. It goes away where the fix matters least. That is exactly what the papers described. It is not a GBP/USD accident.
We also tested the month-end version on three more pairs. We found nothing there, so the month-end question is closed.
The verdict does not change. It just gets more exact: the new fix rules still leave a real reversal on at least three pairs. On none of them is it big enough to pay for itself.
What we learned
1. The 2015 rule change worked. The research from before 2015 describes something you could trade. What is left today is real, but it makes about 0.74% a year at 0.5% risk per trade. That is not enough to be worth the risk of running it.
2. A good first test is needed, but it is not enough. Seeing 42 of 48 combinations make money was a really good sign. But two of our three best groups still failed as soon as the real spread was included. If we had frozen settings based on M1-OHLC results, we would have published numbers that were 0.2 to 0.3 of profit factor too good.
3. "Does it work?" and "Does it pay?" are different questions. Our tests must ask both. This strategy kept 88% of its profit factor but only 39% of its return. It did not fail on the statistics. It failed on the money. That difference is why the return test exists.
The fix reversal now sits in our list as a very useful kind of failed strategy. It proves our process can find a real effect. It also proves that finding a real effect is not the same as finding an edge worth trading.
Case 008 in one PDF: the exact rules, how we tested them, and what we found. Your email unlocks it and the other 11 case files, plus every new one as it lands.
Run the numbers yourself
The free calculators behind the sizing and robustness checks in this test. No signup.