We Tested the Best-Evidenced Idea in Finance at the Scale a Retail Trader Can Reach
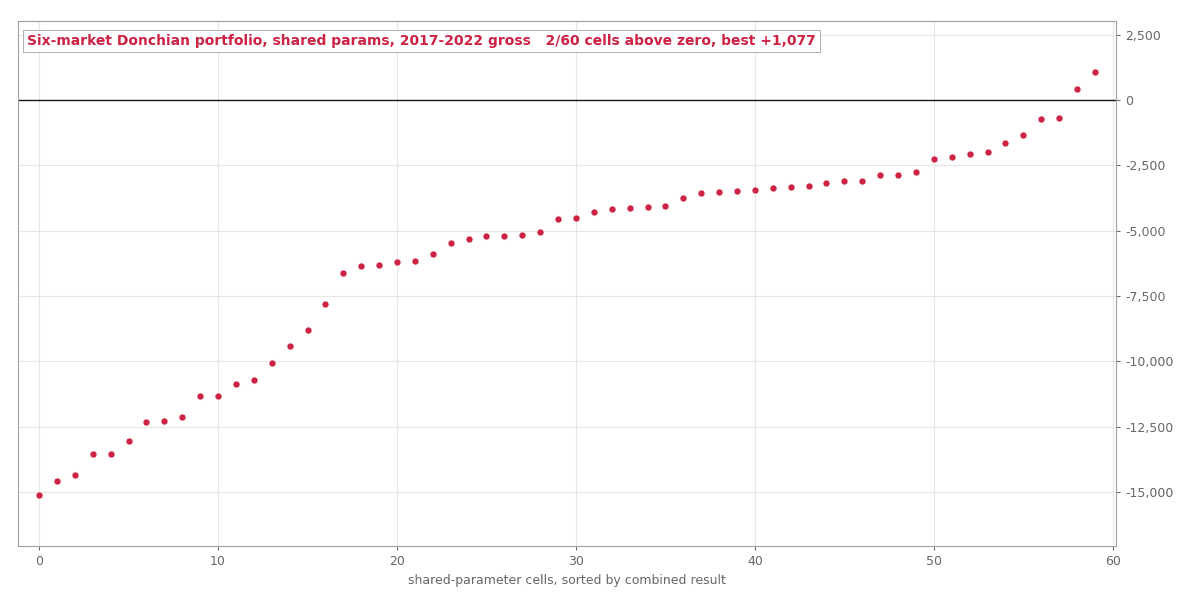
Man Group and AQR say trend following works because it trades many markets. Each market is weak, but together they make a good portfolio. We tried this with the six markets a normal retail account has. 58 of 60 settings lost money.
Does trend following work on a small retail portfolio?
Not with six markets. We used one Donchian signal on the six markets a retail account has. Over five years, 58 of 60 settings lost money. Without gold, the best setting reached a profit factor of only 1.08. The big funds that make trend following work trade 50 to 150 markets.
The idea: many weak signals make one strong portfolio
Trend following means buying when prices go up and selling when they go down, and staying in the trade while the move continues. It has more proof behind it than almost any other trading idea. AQR studied it over a century of data. Man Group trades it on 50 to 150 markets. They report a positive long-term Sharpe ratio (return compared to risk), and a positive one during crises too.
The big funds never said that one single market trends in a reliable way. Their point is different. A weak signal on one market is not worth much. But spread the same signal over many markets that do not move together, and the weak results add up to a strong portfolio. This is called breadth.
We had already tested the weak single-market part ourselves:
- Our BTC Donchian test made money on new data, with a profit factor of 1.12 (money won divided by money lost). We still rejected it.
- The EURJPY version was borderline.
- Gold trend following failed twice, in two different forms.
So we ran the real test. If we put these markets together, does the portfolio work where each market failed alone?
The setup, fixed before any test
We used six markets. That is what a retail MT5 account with good data gives us: EUR/USD, GBP/USD, USD/JPY, EUR/JPY, gold and Bitcoin.
The strategy:
- One Donchian channel signal on the 4-hour chart (H4). A Donchian channel is the highest high and lowest low of the last N bars. We trade when the price closes outside the channel.
- Long and short (we buy and we sell).
- A stop loss based on ATR (Average True Range, a measure of how much the price usually moves).
- We exit when the price crosses back through the channel.
- In-sample period (the data used to choose settings): 2017 to 2022, five years. The 2022 to 2026 period stayed locked, as always.
We wrote three rules into the plan before we touched the tester. Each one stops a specific way of fooling ourselves:
- All six markets, no exceptions. If you drop a market after you see it lose, you are fitting the portfolio to the past.
- One set of settings for every market. Tuning each market separately is where our earlier single-market tests got their nice-looking numbers.
- We judge the combined portfolio, using the same tests every strategy must pass.
We did two pieces of preparation first, and both were worth it:
- We fixed a hole in our Bitcoin data. We imported 65.7 million ticks again for 2019 to October 2020, so the test would not run on broken data.
- We did a quick check of how the six markets move together, using simulated results. The average correlation between pairs of markets was 0.12 (low, so they mostly move independently). That is like having about four independent markets out of the six.
So the benefit of spreading out was really there. The question was whether each market's results were good enough to build on.
The exact rules of every strategy we've put on trial, how we tested each one, and what the data showed. 12 case files so far, free with your email.
The result
They were not. We tested a full grid of 60 setting combinations. Each combination used the same settings on all six markets, added up over five years. Only 2 of the 60 finished above zero.
The best one made $1,077 over 2,597 trades. That is 41 cents per trade. Not one combination passed our stability check. That check needs the settings next to a good setting to make money too.
Here is the result by market for the best combination. It explains the failure better than any theory:
| Market | 5-year result | Profit factor |
|---|---|---|
| BTC/USD | +$5,964 | 1.48 |
| EUR/JPY | +$2,270 | 1.11 |
| USD/JPY | +$1,407 | 1.07 |
| EUR/USD | +$416 | 1.02 |
| GBP/USD | −$522 | 0.97 |
| XAU/USD | −$8,457 | 0.23 |
Bitcoin made good money and gold lost all of it, and more. With 50 futures markets, one very bad market is a small part of the total. With only six markets, one bad market can sink the whole portfolio.
What if we drop gold?
Anyone who looks at that table asks the same question we did: what if you just remove gold? We checked it. This cost nothing, and the locked period stayed locked.
Without gold, 39 of 60 combinations make money. The best one makes +$9,534:
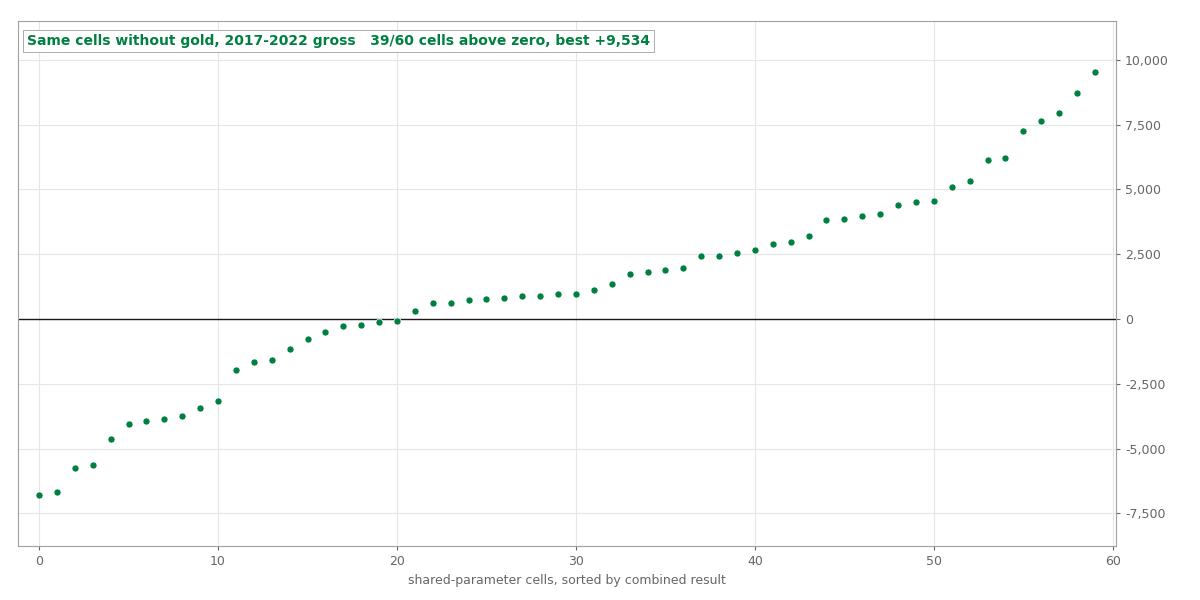 The same 60 setting combinations without gold: mostly positive, but small
Two of those combinations even pass the stability check properly. But it still does not help, and the reason is simple. The better of the two has a portfolio profit factor of only 1.08. That is about 1.3% per year. Our rules need a profit factor of 1.30 in sample before a strategy can even try the out-of-sample test. So this is not a good strategy blocked by a small rule. The edge is just too small.
There is also a fairness problem, and we want to say it clearly. We chose to drop gold after looking at the results. So the "no gold" portfolio stays as a note in our research files. It is not a strategy.
What we think this means
The research from the big funds about trend following is probably right. But it probably does not work at this small size. It works because they trade 50 or more truly different markets, with the low costs of futures trading.
Six retail markets cannot replace that. Four of ours are currency pairs that share currencies with each other, so they are not very different. And using one set of settings for all markets showed us something. Much of our earlier "almost good" single-market results came from tuning each market on its own.
The test also cost us nothing important. We rejected the strategy in sample. We used zero out-of-sample runs, so the locked data is still clean for whatever we test next.
You can see all the strategies we tested, winners and losers, on the results page.
Past performance does not mean future results. These are backtests with real trading costs. They are not live trading results.
The exact rules of every strategy we've put on trial, how we tested each one, and what the data showed. 12 case files so far, free with your email.
Run the numbers yourself
The free calculators behind the sizing and robustness checks in this test. No signup.