A Bitcoin Trend System Made $5,380 on Unseen Years. We Still Won't Trade It.
We tested a Bitcoin Donchian breakout with a real broker's $5 spread, not the data vendor's $50-115. It made $5,380 on four new years of data. But it still failed three of our quality checks, and a realistic drawdown is near 30%.
Does a Donchian breakout work on Bitcoin?
Partly. With a real broker's spread, a Bitcoin Donchian breakout made $5,380 over four out-of-sample years, a profit factor of 1.17. But it failed three of our quality checks, and our random tests say a drawdown near 30% is likely. So we do not trade it.
The idea
Channel breakouts, like the ones the famous Turtle traders used, are the oldest public trend system. The rules are simple:
- Buy when price makes a new high of the last N bars.
- Sell when price makes a new low of the last N bars.
- Let the exit rule do the work.
A Donchian channel is just the highest high and lowest low of the last N bars. If any market should reward this system, it is Bitcoin. Bitcoin often has long runs in one direction. These come from waves of new buyers, and from crashes where many leveraged traders are forced to sell at once. A breakout system needs exactly these long runs.
We tested it on seven years of Bitcoin tick data. But the first thing the test showed us was not about the strategy. It was about the cost of trading it.
The rules we fixed before testing
One position at a time, on 4-hour bars, buys and sells:
- Buy when the last finished close is the highest close of the past 10 bars, and is above the middle line of the 55-bar channel.
- Sell short in the opposite case: the lowest close of the past 10 bars, below the 55-bar middle line.
- Exit when price closes through the opposite 15-bar channel.
- Keep a stop loss at 1.5 times the 20-bar ATR (average true range, the average size of a bar's move). This is only protection against a disaster.
- Risk 1% of the account on each trade.
Whose spread are you paying?
The spread is the gap between the buy and the sell price. It is a cost on every trade.
Historical tick data comes from a data vendor. The vendor's Bitcoin prices include the vendor's spread:
- In our Dukascopy data, that spread was roughly $50 to $115 per bitcoin from 2019 to 2021.
- In 2019 it was more than 1% of the price.
A retail broker charges much less:
- We measured IC Markets live at $5 per bitcoin, about 0.006% of the price.
- IC's own records show roughly $6 to $12 in 2021 and 2022.
So we priced every trade at the broker's cost. We gave back the vendor's spread and charged IC's spread instead. We also added IC's overnight financing on long positions: 20% a year, charged for every night the position is open.
The difference between those two spreads changes the result. Here are the same 258 in-sample trades from 2019 to 2021, priced three ways.
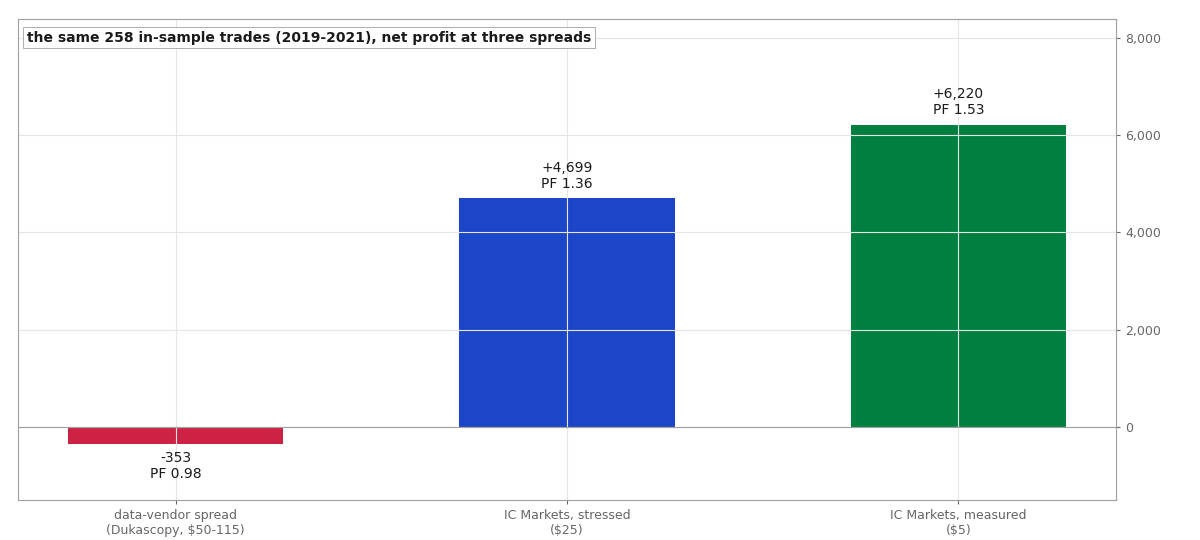 The same 258 in-sample trades, 2019 to 2021, net profit at three spreads. At the data vendor's spread the system loses; at the broker's it makes money.
- Vendor's spread: loses $352.86, profit factor 0.98.
- IC's $5 spread: makes $6,219.92, profit factor 1.53.
- A stress test at $25 (five times the measured spread): still makes $4,698.52.
The profit factor is the money won divided by the money lost. Above 1.0 means a profit.
At the broker's price, every in-sample year made money: 18.4%, 23.8% and 10.7%.
A trend system has big winners but many losers. When a market is this expensive to trade, the spread decides which side is bigger.
The exact rules of every strategy we've put on trial, how we tested each one, and what the data showed. 12 case files so far, free with your email.
One test on new years
Then we ran the fixed settings on 2022 to 2025, one time only. This is our out-of-sample data, years the strategy had never seen. With IC Markets' costs, on a $10,000 account:
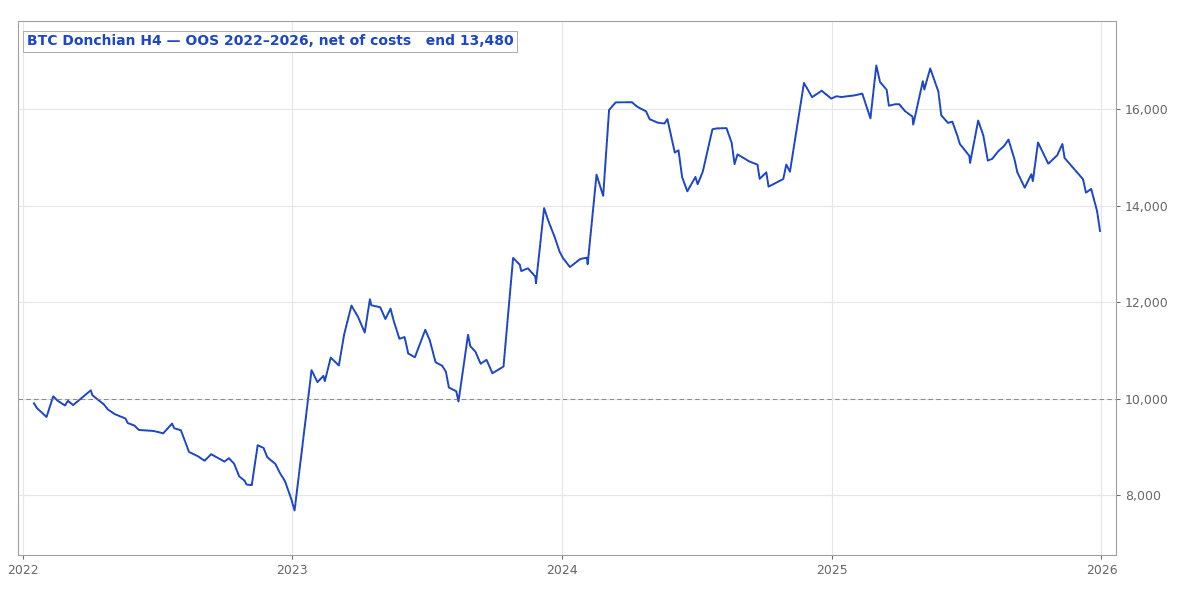
- $5,380.47 profit
- 425 trades
- profit factor 1.173
- maximum drawdown 14.66% (the biggest drop of the account from a high point)
- about 11.4% a year, after paying $2,130.25 in overnight financing on the buys
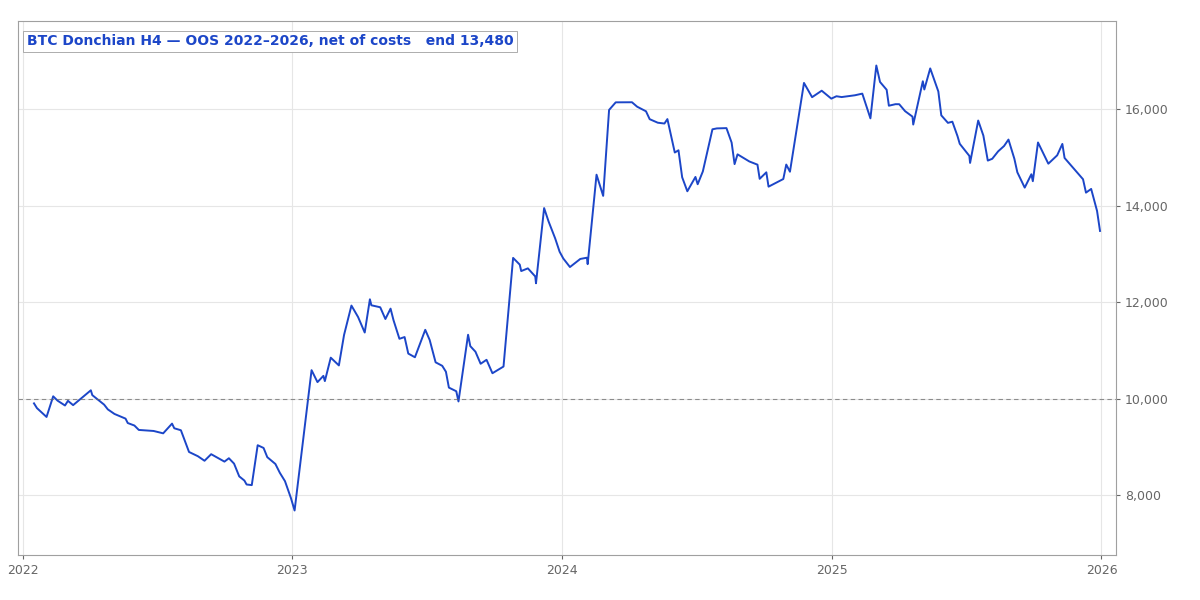 Out-of-sample equity, 2022 to 2025, at IC Markets' spread, commission and financing. Almost all of the gain came in 2023 and 2024.
It passed the checks that show the edge is real:
- The profit factor kept 77% of its in-sample value. Our minimum is 70%.
- It still made money with the spread raised to $25 ($3,986.47).
- It still made money with commission raised by $5 a side ($4,683.47).
- It beat the simplest trend rule we could write: buy whenever Bitcoin went up over the past twelve months. The Donchian system's return per unit of drawdown was 0.777. The simple rule's was 0.636.
Year by year, the results were much less smooth.
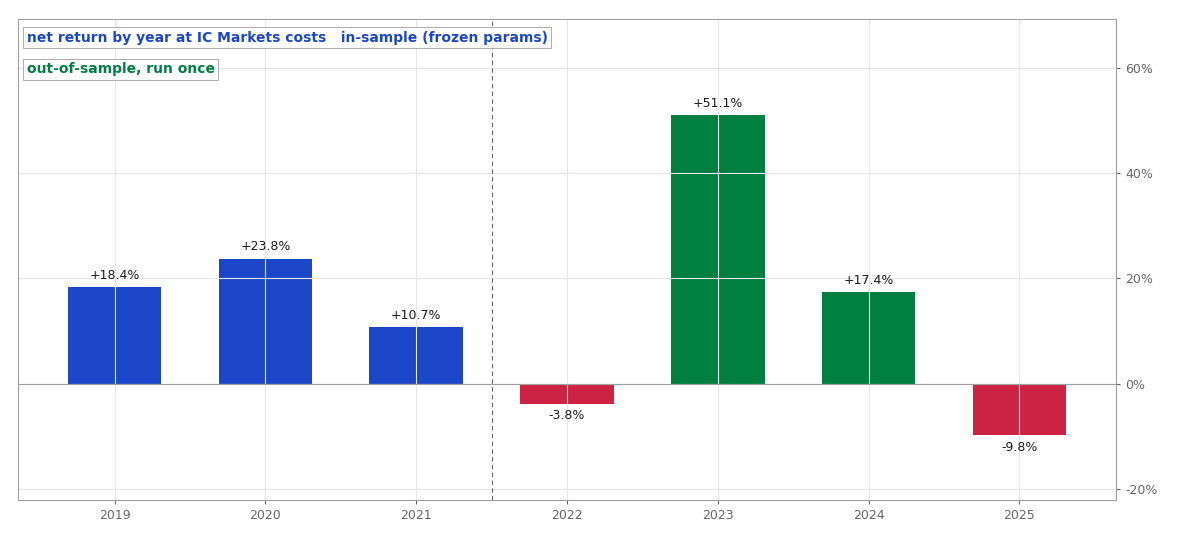 Net return by year at IC Markets' costs. In-sample years in blue, the single out-of-sample run in green and red.
- 2022: lost 3.8%
- 2023: made 51.1%
- 2024: made 17.4%
- 2025: lost 9.8%
Two good years paid for two losing years. The system won 25.4% of its trades. The average winner was $337.63 and the average loser was $98.05. This is the normal picture for trend following: few wins, but big ones.
Where the edge comes from
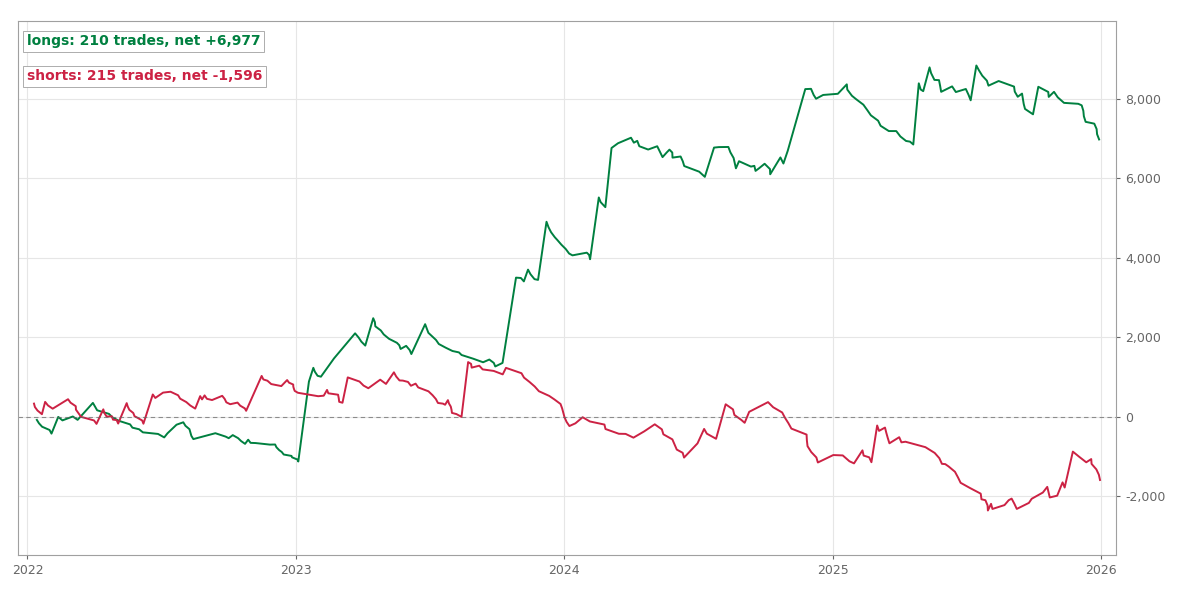 Total net profit by side, out-of-sample 2022 to 2025. The buys made the money; the shorts lost part of it back.
- The 210 buy trades made $6,976.69.
- The 215 short trades lost $1,596.22.
Bitcoin went up for most of this period. A system that trades both sides sells into every dip, and many dips were only short pauses in a bigger move up. The buy side also pays the broker's 20% financing, and it still makes the profit. So catching the trend on the buy side is the real part of the edge.
How much of it was luck?
One out-of-sample run is only one path through history. So we tested other possible paths with a Monte Carlo test (many random versions of the same trades):
- We picked from the 425 trades at random, ten thousand times, and rebuilt the account each time.
- We also put the same trades in random orders, to see how big the drawdown could have been.
Each run reshuffles the 425 out-of-sample trades, drawing them with replacement, and totals the result. The blue line is what actually happened; the shaded band left of zero is every run that ended in the red.
The profit could have been very different. In the random versions, the net result went from a $5,879.60 loss to a $17,545.48 gain (the 2.5th to 97.5th percentiles). The median was $5,222.86. And 19.45% of them ended with a loss.
The drawdown result is more important. The real run had a 14.66% drawdown. That was smaller than almost every random order of the same trades:
- median random order: 29.72% drawdown
- 95th percentile: 50.68%
- 99th percentile: 64.27%
The real path was lucky. Most of the profit came early, and it softened the losses that came later. If you run this system, plan for a drawdown near 30%, not 15%.
Why we still reject it
Our checks ask two questions:
- Is the edge real?
- Is it worth trading?
The answer to the first question is yes. But it fails three checks on the second:
- Sharpe per trade of 0.043, below our minimum of 0.05. (The Sharpe ratio compares the return with how much the results jump around.)
- Out-of-sample drawdown 2.35 times the in-sample one. Our limit is 1.5.
- A 19.45% chance of a loss in the random tests. Our limit is 15%.
Put it together: a profit factor of 1.17, a realistic drawdown near 30%, and a one-in-five chance of losing money over four years. The edge is real on paper. But it would be very hard to live with in a real account. We are not trading it.
What we learned
On Bitcoin, the trend is on the buy side. A system that also sells short loses part of its edge by fighting the market's direction.
The bigger lesson is about backtests. The same strategy loses or wins depending on whose spread you pay. Historical data quietly charges the data vendor's spread. Before you trust any backtest on a market with wide spreads in the data, compare the costs with what your broker really charges.
The exact rules of every strategy we've put on trial, how we tested each one, and what the data showed. 12 case files so far, free with your email.
Run the numbers yourself
The free calculators behind the sizing and robustness checks in this test. No signup.