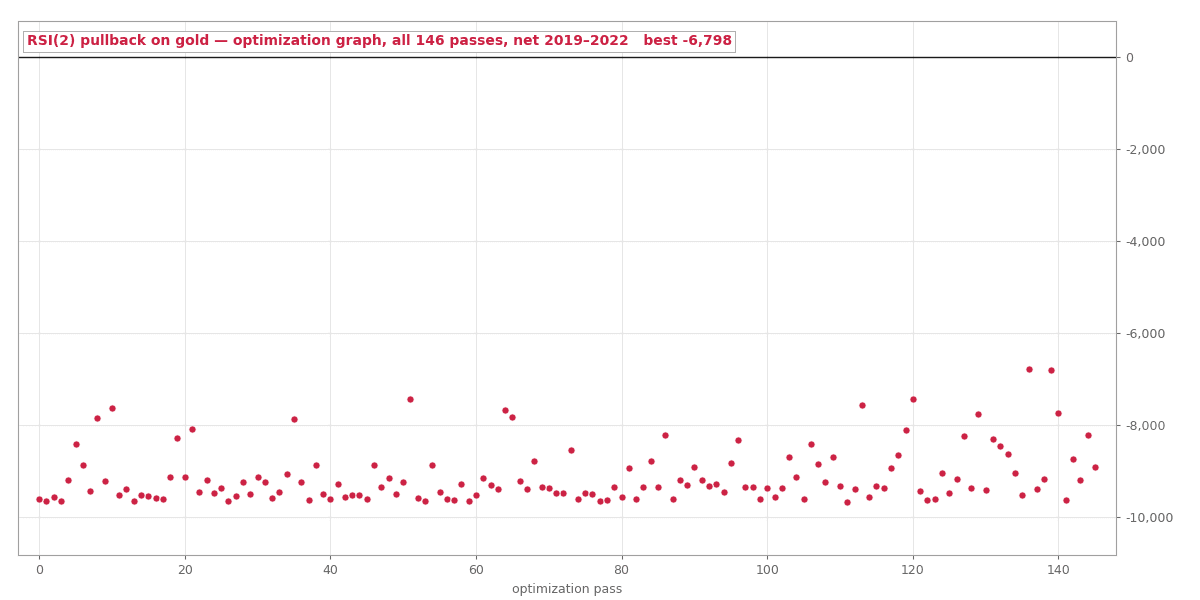
All 146 Configurations Lost Money: RSI(2) Mean Reversion Meets Gold
We transferred one of the most replicated mean-reversion strategies from daily equities to gold H1 and optimized it on three years of tick data with real costs. The optimizer found nothing — and the reason why is a lesson in edge geometry.
Larry Connors' RSI(2) pullback is one of the most replicated edges in retail quant trading: when the 2-period RSI is deeply oversold while price holds above its 200-period average, buy the dip; exit when the RSI snaps back. It's documented on daily US equities across decades, and an MQL5 article recently rebuilt three variants of it for MetaTrader.
We wanted to know: does it transfer to gold on the hourly chart? Gold overshoots intraday constantly, which sounds like mean-reversion heaven. Our own spec notes flagged it honestly as a transfer hypothesis — "treat a rejection as informative, not surprising." Still, we didn't expect what the optimizer returned.
146 configurations. Zero survivors.
We optimized the RSI entry threshold, the exit threshold, the trend-filter period, and the ATR stop multiple over 2019–2022 — real tick data, commission included. Every single configuration lost money. Not marginally: the best of 146 finished at −$6,798 on a $10,000 account, and the profit factors clustered around an almost impressive 0.05–0.10.
A profit factor of 0.05 means gross wins were five cents per dollar of gross losses. That's not "no edge" — that's a structurally broken trade geometry.
The autopsy: winners smaller than the spread
The mechanism is simple once you see it, and it has nothing to do with the signal being "wrong":
- A 2-period RSI snaps back within one or two H1 bars, so the strategy's winners captured only a few tenths of a dollar of gold movement per trade.
- Gold's real spread in our Dukascopy tick data is $0.46 to $0.88 for most of the period. The typical winner was smaller than the spread it paid to get in and out.
- The losers, meanwhile, ran the full ATR-based stop — $8 to $12 each.
Sub-spread wins against full-size losses: no threshold, filter period, or stop multiple can fix that arithmetic. The published RSI(2) edge lives on daily bars, where the average move dwarfs the spread. On gold H1, the geometry inverts, and the strategy becomes a machine for donating the spread to the market — 339 to 394 times per pass.
Why this rejection cost almost nothing
Our pipeline separates in-sample optimization (2019–2022) from a one-shot out-of-sample window (2022–2026) that only frozen candidates may touch. This strategy never got that far: with nothing profitable in-sample, there was nothing to select, nothing to freeze, and zero out-of-sample runs consumed. Total cost of finding out: one optimization run, about ten minutes.
Compare that with the usual path — trading a plausible-sounding strategy live until the spread bleed becomes undeniable.
What changed in our process
Every rejection should upgrade the pipeline, and this one did. Our pre-test code review checklist now includes an edge-geometry check: estimate the strategy's typical winner in price terms and compare it to the instrument's real spread before running anything. Expected winner under ~3× spread means the backtest can only prove that the spread wins.
More from the lab: the Tokyo-fix anomaly study (a real edge we rejected anyway) and the range breakout that started this project (one strategy, two pairs, opposite endings). All tested strategies — winners and losers — are on the results page.
Past performance is not indicative of future results. These are backtests with realistic cost assumptions, not live trading records.